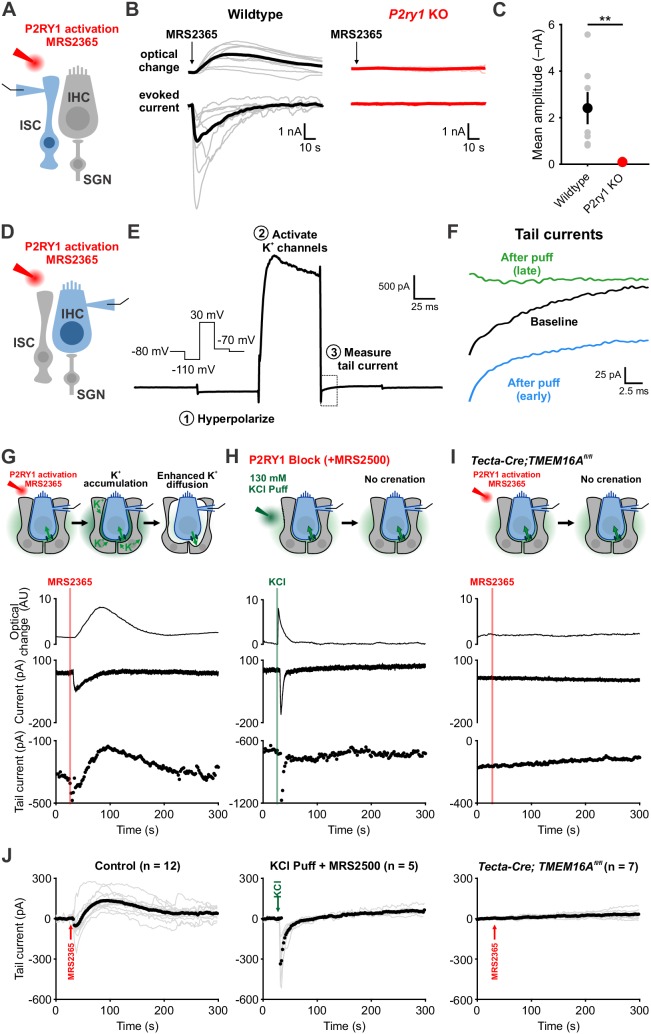
Figure 4. Activation of P2RY1 results in an initial accumulation of extracellular K+, followed by crenation and enhanced K+ clearance.
(A) Schematic of whole-cell recording configuration from ISCs with puffs of MRS2365 (10 μM), a P2RY1 agonist. (B) Optical change (crenation) and current elicited with MRS2365 puffs in wildtype and P2ry1 KO mice (C) Plot of mean current amplitude with MRS2365 puffs. n = 8 ISCs, 8 cochleae from 4 P6-8 wildtype mice and n = 7 ISCs, 7 cochleae from four from P2ry1 KO mice (two-tailed Student’s t test; **p<0.005). (D) Schematic of whole-cell recording configuration from IHCs with puffs of MRS2365 (10 μM). (E) Example current trace and voltage-protocol designed to measure potassium accumulation. This protocol consisted of: (1) a hyperpolarizing step to −110 mV to relieve K+ channel inactivation, (2) a depolarizing step to +30 mV to activate outward K+ currents, and (3) a step to −70 mV to obtain a ‘tail’ current. Dashed box indicated tail current measurement period indicated in (F). (F) Tail currents observed during baseline, immediately following the MRS2365 puff (with 2 s), and after the puff (30 s). (G) Model of K+ dynamics following MRS2365 stimulation. Initially, extracellular K+ rapidly increases following stimulation, but ISCs crenate, increasing the amount of extracellular space and K+ buffering. (bottom) Exemplar optical change (crenation), holding current, and tail current as a function of time with respect to MRS2365 puff. (H) Similar to G, but with KCl puffs (130 μM) in cochleae treated with MRS2500. (I) Similar to G, but in Tecta-Cre;TMEM16Afl/fl mice where TMEM16A has been conditionally removed from the sensory epithelium (see Figure 4—figure supplement 1). No crenations were observed with MRS2365 stimulation. (J) Group tail currents across conditions from G-I. Gray lines indicate individual recordings; black points indicate the mean. Baseline was normalized to 0 pA for all traces. n = 12 IHCs, 11 cochleae from 9 P6-8 wildtype mice with MRS2365 stimulation, n = 5 IHCs, 5 cochleae from five wildtype mice with KCl stimulation, and n = 8 IHCs, 8 cochleae from 5 Tecta-Cre;TMEM16Afl/fl mice with MRS2365 stimulation. See Figure 4—source data 1 for plotted values and statistics.
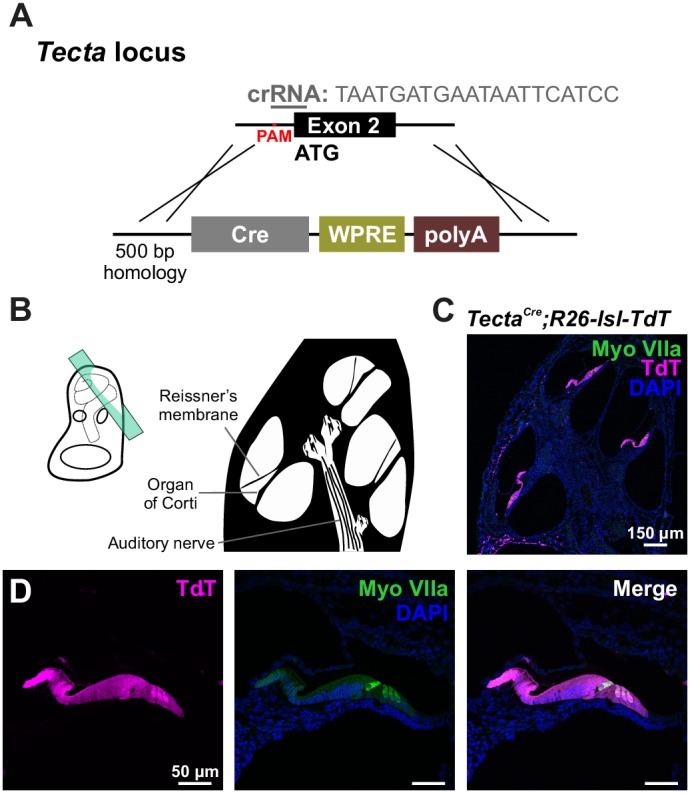
Figure 4—figure supplement 1. Crispr-Cas9 mediated generation of the supporting cell specific Tecta-Cre mouse line.


