. 2020 Jan 8;9:e52160. doi: 10.7554/eLife.52160

Figure 5. Large-scale coordinated activity in the cochlea requires P2RY1.

(A) Exemplar Ca2+ transient in excised cochlea from Pax2-Cre;R26-lsl-GCaMP3 mice. Note the coordinated activation of ISCs, IHCs, and SGNs. (B) Traces of fluorescence intensity over time taken from ROIs that span the entire IHC, ISC, and SGN regions indicated in (A). (C) Plot of event frequency before and during application of MRS2500 (1 μM). n = 5 cochleae from 3 P5+1DIV (day in vitro) Pax2-Cre;R26-lsl-GCaMP3 mice (two-tailed paired Student's t test with Bonferroni correction; ****p<5e-5, ***p<0.0005). (D) Exemplar images of IHC Ca2+ transients. ROIs were drawn around every IHC for subsequent analysis (bottom). (E) Correlation matrices generated by calculating the linear correlation coefficient for all IHC pairs before and after MRS2500 application. (F) Plot of average correlation coefficient calculated between the four nearest IHCs. n = 5 P5+1DIV (day in vitro) cochleae from 3 Pax2-Cre;R26-lsl-GCaMP3 mice (two-tailed paired Student's t test with Bonferroni correction; ***p<0.0005, ns, not significant). See Figure 5—source data 1 for plotted values and statistics.

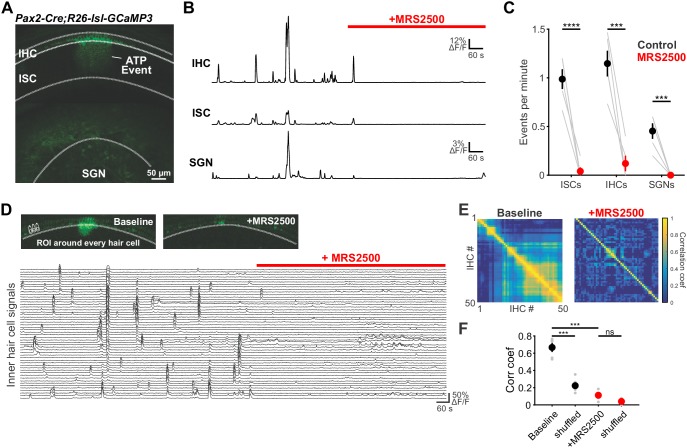
Figure 5—source data 1. Plotted values and statistics for Figure 5.

Figure 5.

Figure 5—figure supplement 1. P2ry1 KO mice exhibit reduced Ca2+ transients in ISCs.

Figure 5—figure supplement 1.

(A) Maps showing maximum area of spontaneous Ca2+ transients in control (Pax2-Cre;R26-lsl-GCaMP3) and P2ry1 KO (Pax2-Cre;R26-lsl-GCaMP3; P2ry1–/–) mice. Ca2+ transients in the ISC and IHC regions are color-coded based on time of occurrence as indicated in timeline below image. Imaging was performed at room temperature. (B) Plots of Ca2+ event frequency and area in control and P2ry1 KO mice. n = 5 P5+1DIV cochleae from three control mice and 5 P5+1DIV cochleae from 4 P2ry1 KO mice (two-tailed Student's t test with Bonferroni correction, ****p<0.05). (C) Exemplar images of IHC Ca2+ transients. ROIs were drawn around every IHC for subsequent analysis (bottom). (D) Correlation matrices generated by calculating the linear correlation coefficient for all IHC pairs in P2ry1 KO mice. (E) Plot of average correlation coefficient among the four nearest neighboring hair cells. Data from MRS2500 experiment (Figure 4) is reproduced here for comparison. n = 5 cochleae from 3 control and 4 P2ry1 KO mice (two-tailed paired Student's t test with Bonferroni correction; ****p<5e-5). See Figure 5—figure supplement 1—source data 1 for plotted values and statistics.
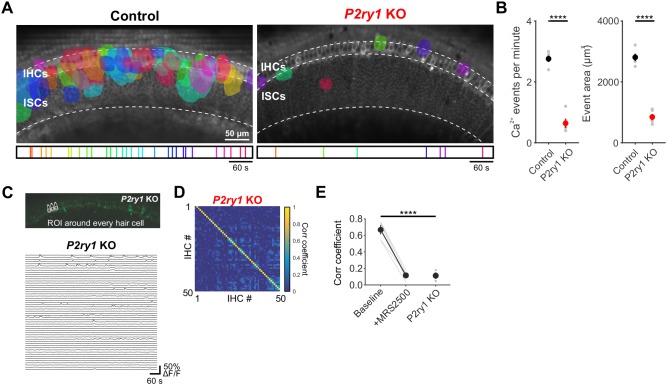
Figure 5—figure supplement 1—source data 1. Plotted values and statistics for Figure 5—figure supplement 1.