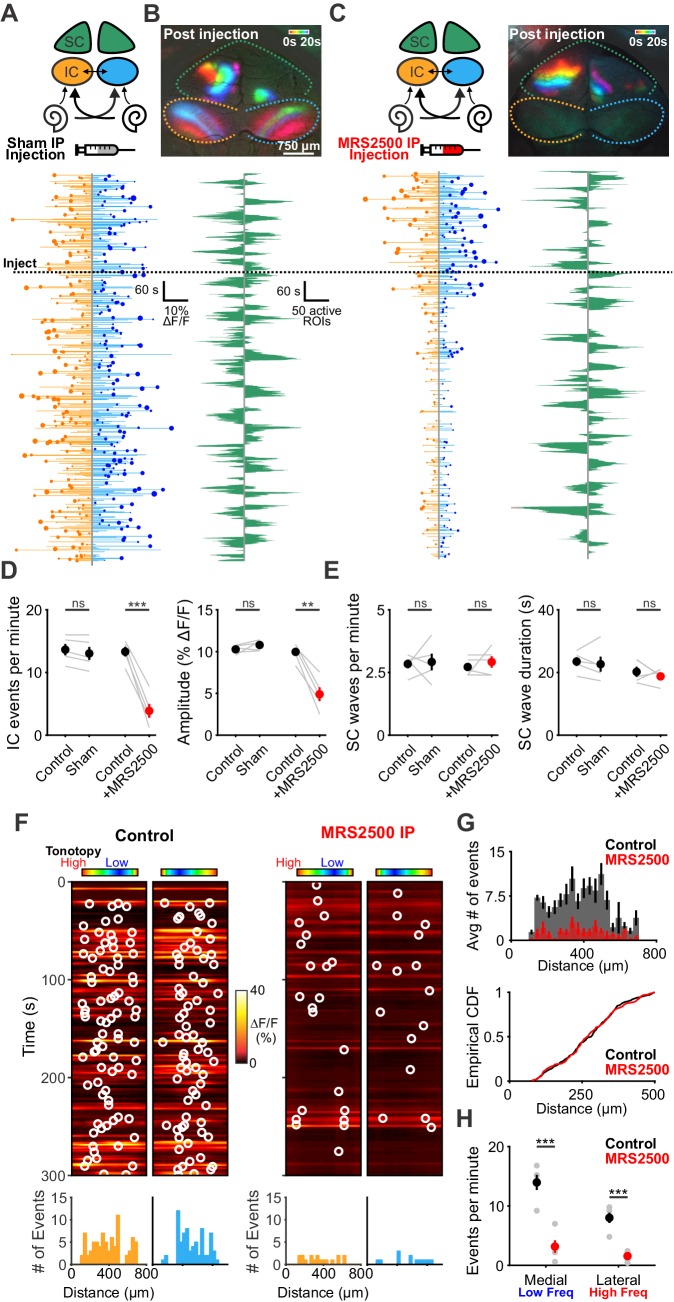
Figure 8. Delivery of MRS2500 in vivo dramatically reduces spontaneous activity in the developing auditory system.
(A) Diagram illustrating flow of information to the midbrain and the visual superior colliculus. Sham solution (5% mannitol) was injected via IP catheter during imaging. (bottom) Activity over time in left and right IC in an individual where each line indicates the fluorescence intensity of each detected event; the circle indicates the dominant lobe, and the size of the circle indicated the difference in fluorescence. Dashed line indicates time of injection. (B) Calcium transients in the midbrain, color-coded based on time of occurrence following sham injection. (bottom) Calcium transients observed in the left and right SC. (C) Similar to (A) and (B), but with injection of MRS2500 (50 μL of 500 μM MRS2500 in 5% mannitol solution). (D) Plot of IC event frequency and amplitude in sham and MRS2500 injected animals. n = 5 mice for each condition (two-tailed paired Student’s t test with Bonferroni correction; ***p<0.005, **p<0.005, ns: not significant). (E) Plot of SC wave frequency and duration in sham and MRS2500 injected animals. n = 5 P6-8 mice for each condition (two-tailed paired Student’s t test with Bonferroni correction; ns: not significant). (F) Activity along the tonotopic axis over a five-minute time frame in the left and right IC before (left) and after (right) MRS2500 injection. Circles indicate detected peaks. (bottom) Histograms of peak locations. (G) Histogram of average number of events before (black) and after (red) MRS2500 injection. (bottom) Cumulative distribution function of event locations across the tonotopic axis pooled from all animals. Events from left and right IC were combined for each experiment. (H) Quantification of event frequency in the medial (low frequency) and lateral (high frequency) regions of the IC. n = 5 P6-8 mice (two-tailed Student's t test with Bonferroni correction; ***p<0.005). See Figure 8—source data 1 for plotted values and statistics.

