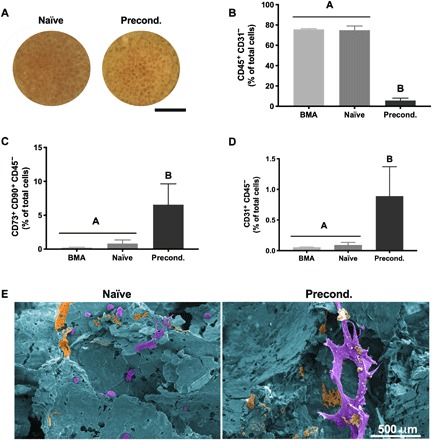
Fig. 2. Preconditioning increases MSC and EC content in osteogenic grafts.

(A) Gross morphology images of (left) naïve and (right) preconditioned grafts after culture. Scale bar, 4 mm. (B to D) Percentage of cells that are (B) hematopoietic (CD45+CD31−), (C) endothelial (CD31+CD45−), and (D) mesenchymal (CD73+CD90+CD45−) in origin (n = 4 to 5). (E) Representative SEM images of (left) naïve and (right) preconditioned grafts false-colored to show cells in purple, ECM in orange, and scaffold in blue. Scale bar, 500 μm.
