
Fig. 4. Preconditioned grafts enhance early vascularization.
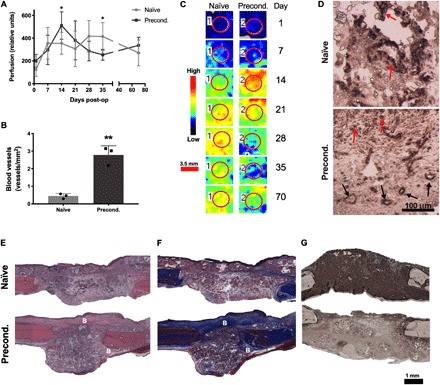
(A) Raw perfusion values from LDPI (n = 6). (B) Quantification of vessel density (n = 3). (C) Representative LDPI images color mapped to reveal the magnitude of perfusion quantified from the defect area denoted by a red circle. Scale bar, 3.5 mm. (D) Immunostaining for human CD31. Black arrows denote vessel structures, and red arrows denote positive staining for non–vessel-forming cells. Scale bar, 100 μm. (E) Hematoxylin and eosin (H&E), (F) Masson’s trichrome, and (G) anti-OCN staining. Scale bar, 1 mm. New woven bone is denoted B. *P < 0.05, **P < 0.01.