
Fig. 1. Cryo-EM structure of the undocked INX-6 hemichannel in a nanodisc.
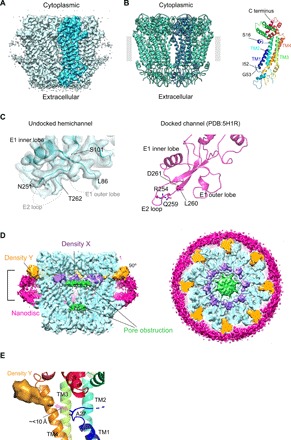
(A) The 3D reconstruction of a nanodisc-reconstituted WT INX-6 hemichannel viewed parallel to the membrane. The subunit highlighted in blue represents a monomer. The map contour level is 2σ. (B) Octameric (left) and monomeric (right) ribbon models of an undocked hemichannel of WT INX-6 in a nanodisc. A single subunit of the octamer is indicated in dark blue, the extracted monomer is in rainbow colors, and the lipid bilayer boundary is indicated by a gray band. The N-terminal residue is assigned from S16. S16, I52, and G53 are represented in stick style. The four transmembrane helices are indicated as TM1 to TM4. (C) Comparison of the extracellular docking surface of WT INX-6. (Left) Ribbon style model and density map (surface representation in gray) of the nanodisc-reconstituted undocked hemichannel are superimposed. Disordered peptides of the E1 outer lobe and E2 loop are shown as dashed lines, and the flanking residues of L86, S101, N251, and T262 are indicated. (Right) Ribbon style model of a docked junction channel (PDB: 5H1R) (6). The amino acid side chains that participate in the hydrogen bonds are depicted in stick style and are all included in the disordered regions in the undocked hemichannel. The map contour level is 2σ. (D) Sliced views of the Gaussian-filtered 3D density map of the undocked WT INX-6 hemichannel as a vertical cross section (left) and cytoplasmic top view of the slab surface (right). Slab thickness corresponds to the bracket in a side view (left). The surrounding nanodisc densities are shown in magenta, and the double-layer densities that obstruct the pore are shown in green. Newly observed densities X and Y are shown in slate and orange, respectively. The map contour level is 1.5σ. (E) Positional relationship of density Y to TM1 of WT INX-6. Density Y is located within a distance of less than 10 Å from A27, the closest residue in TM1 to density Y. The map contour level is 2σ.