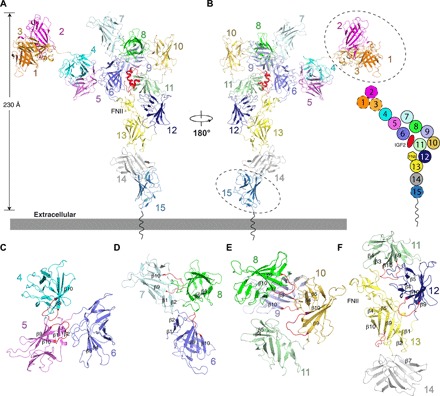
Fig. 3. IGF2R conformational changes after binding IGF2 in pH 7.4.

(A) Overall structure of the IGF2R-IGF2 complex. The color scheme of IGF2R is the same as in Fig. 1A. IGF2 is highlighted in red. (B) Overall structure of the IGF2R-IGF2 complex rotated by 180° with respect to (A). The schematic diagram of this state is shown on the right. Because of low resolution, domains 1 to 3 and domain 15 were not built into the experimental map but modeled (indicated by dashed ovals) in (A) and (B) based on the cryo-EM map. (C) The interaction interfaces between domains 4, 5, and 6. (D) The interaction interfaces between domains 6, 7, and 8. (E) The interaction interfaces between domains 8, 9, 10, and 11. (F) The interaction interfaces between domains 11, 12, 13, and 14. All the structural elements involved in interactions are indicated. The β9-β10 loop is shown in red.
