
Fig. 1. Adolescent female mice, but not adolescent male mice, carrying the FAAH SNP demonstrate increased VTA-NAc connectivity and TH-labeled cells in the VTA.
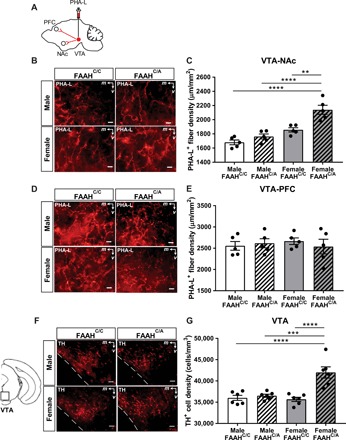
(A) Schematic of PHA-L injected into the VTA of male and female FAAHC/C and FAAHC/A mice at P25. NAc and mPFC were analyzed for fiber density at P35. (B) Representative images of PHA-L projection labeling in the NAc of adolescent male and female FAAHC/C and FAAHC/A mice injected with the anterograde tracer, PHA-L, in the VTA. Scale bars, 10 μm. (C) Adolescent female FAAHC/A mice show increased density of PHA-L projection labeling in the NAc compared to adolescent female FAAHC/C mice, male FAAHC/C mice, and male FAAHC/A mice [one-way analysis of variance (ANOVA): F3,16 = 22.02, P < 0.0001, n = 5 per group, **P < 0.01, ****P < 0.0001 post hoc Bonferroni tests]. (D) Representative images of PHA-L projection labeling in the mPFC of adolescent male and female FAAHC/C mice and FAAHC/A mice injected with the anterograde tracer, PHA-L, in the VTA. Scale bars, 10 μm. (E) Adolescent male and female FAAHC/C and FAAHC/A mice show similar density of PHA-L projection labeling in the mPFC (one-way ANOVA: F3,16 = 0.2351, P = 0.8706, n = 5 per group). (F) Representative images of the VTA showing cells positive for TH immunoreactivity. (G) Adolescent female FAAHC/A mice show increased density of TH-labeled neurons compared to male FAAHC/C mice, male FAAHC/A mice, and female FAAHC/C mice (one-way ANOVA: F3,20 = 14.51, P < 0.0001, n = 6 per group, ***P < 0.001 post hoc test, ****P < 0.0001 Bonferroni test).