
Fig. 5. Spatial-temporal comparison of speleothem δ18O records from the SEY, Dongge (2) and Sanbao (1) caves in southern China during MIS 5.
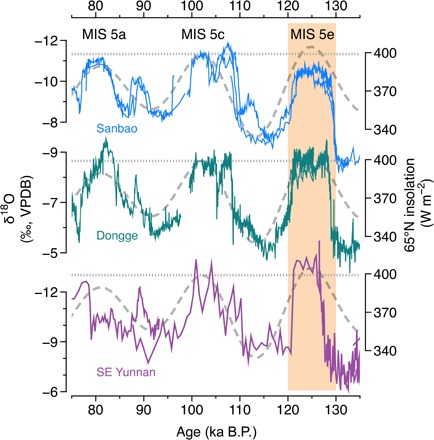
The summer (21 July) insolation at 65°N (the gray curve) is also plotted for comparison. To facilitate the comparison, we aligned the speleothem δ18O values during MIS 5c with the insolation peak. The dashed lines, drawn from the MIS 5c insolation peak, indicate the difference among the three records in their amplitudes of δ18O minima during MIS 5.