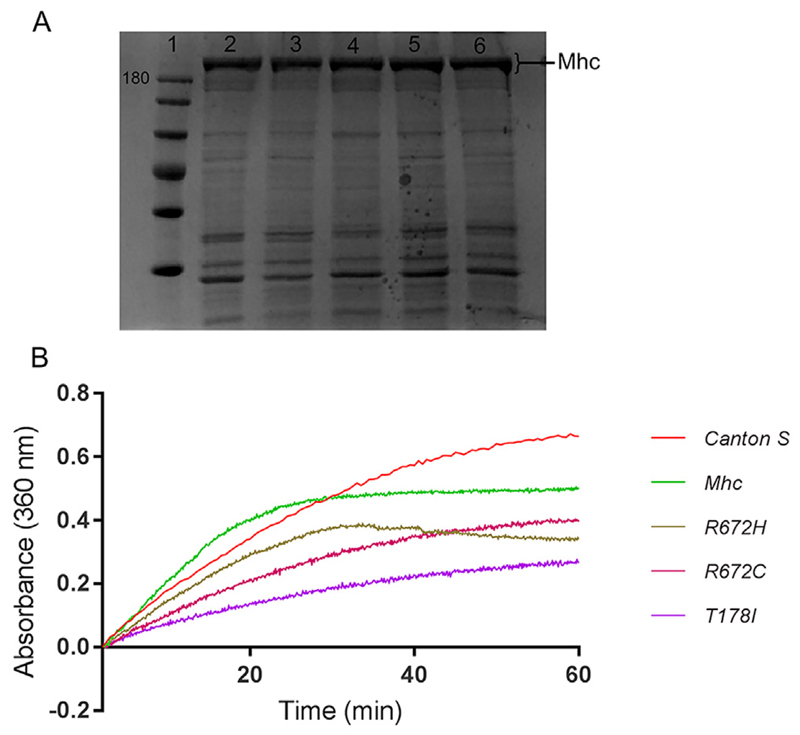
Fig. 6. FSS mutant MHC exhibit decreased ATPase activity.
Coomassie stained SDS-PAGE showing MHC protein (high molecular weight band of about 205 KDa), where lane 1 is molecular weight marker with 180 KDa band labeled, and lanes 2–6 are protein samples enriched for MHC (2 μg each) from DLMs of wild type Canton S (lane 2), Mhc1/CyO; Mef2GAL4/UAS-Mhcwt (lane 3), Mhc1/CyO; Mef2GAL4/UAS-MhcT178I (lane 4), Mhc1/CyO; Mef2GAL4/UAS-MhcR672H (lane 5) and Mhc1/CyO; Mef2GAL4/UAS-MhcR672C (lane 6) flies respectively (A). Rate of phosphate released by the MHC ATPase indicated by absorbance at 360 nm as a function of time (B). The graphs are normalized to a reaction mix without ATP. Graphs indicate that the ATPase activity is reduced in the 3 FSS mutant Mhc transgenic lines compared to controls, with the most drastic reduction observed in the case of T178I mutation (B). Data shown here is from a single assay.

