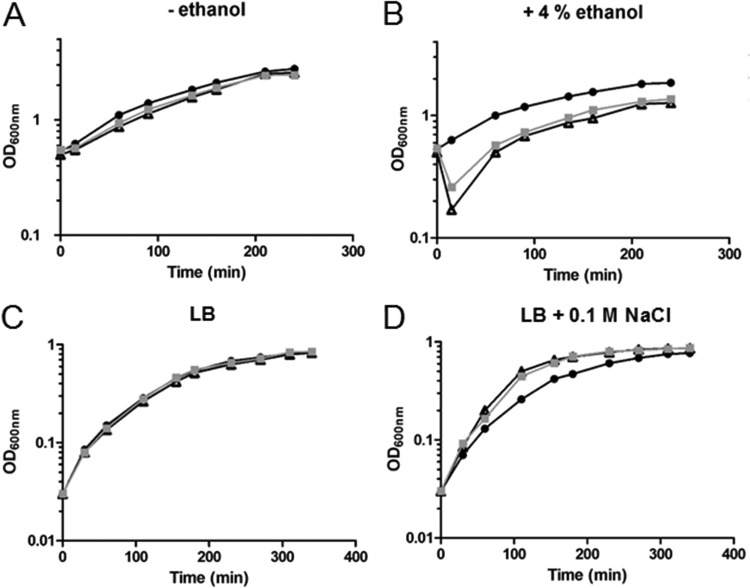
FIG 3.
Effects of ethanol and NaCl stresses on growth of wild-type, ΔmntR, and Δzur cells. (A) Growth curves of the wild-type (black symbols), ΔmntR (white symbols), and Δzur (gray symbols) strains grown in LB medium without ethanol addition. A representative assay is represented. (B) Growth curves of the wild-type (circles), ΔmntR (triangles), and Δzur (squares) strains grown in LB medium after addition of 4% ethanol (final concentration) at an OD600 of 0.6. A representative assay is represented. (C) Growth curves of the wild-type (black symbols), ΔmntR (white symbols), and Δzur (gray symbols) strains grown in LB medium without NaCl addition. A representative assay is represented. (D) Growth curves of the wild-type (circles), ΔmntR (triangles), and Δzur (squares) strains grown in LB medium with addition of NaCl at 0.1 M. A representative assay is represented.

