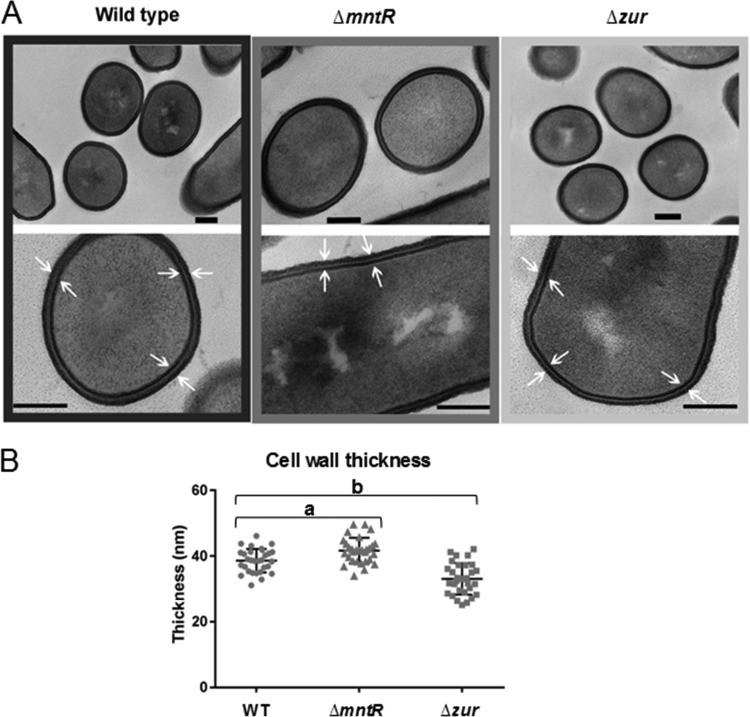
FIG 5.
The mntR and zur deletions are associated with altered cell wall thickness. (A) Transmission electron microscopy images of representative cells of wild-type, ΔmntR, and Δzur cells during mid-log growth phase. Bars, 100 nm. (B) Dot blot graph of the cell wall thickness. Each dot represents a measurement for a single bacillus. a, P = 1.8 · 10−4 <0.05; b, P = 4.4 · 10−6 <0.05.

