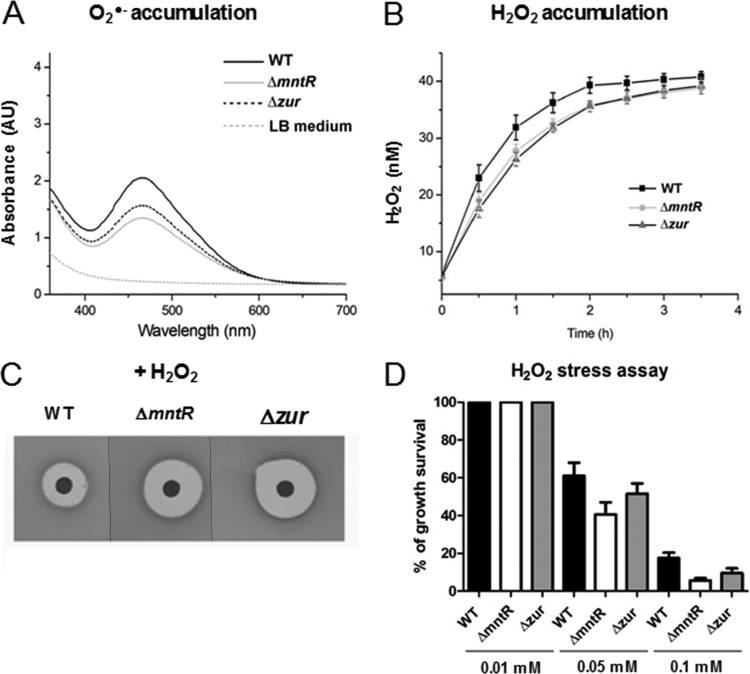
FIG 6.
ROS accumulation and oxidative stress assays in ΔmntR and Δzur mutants. (A) Quantification of O2·− produced in wild-type (WT), ΔmntR, and Δzur cells at an OD600 of 1 in LB medium. (B) Quantification of H2O2 produced in WT, ΔmntR, and Δzur cells during 4 h of growth in LB medium. (C) Plates from a disk diffusion assay with a drop of 3 M hydrogen peroxide (H2O2). (D) The histograms represent the percentage of survival of WT, ΔmntR, and Δzur cells at 15 min after addition of 0.01, 0.05, or 0.1 mM H2O2. The survival rate was determined as the ratio of the number of CFU per milliliter after 15 min to the number of CFU per milliliter before addition of H2O2.

