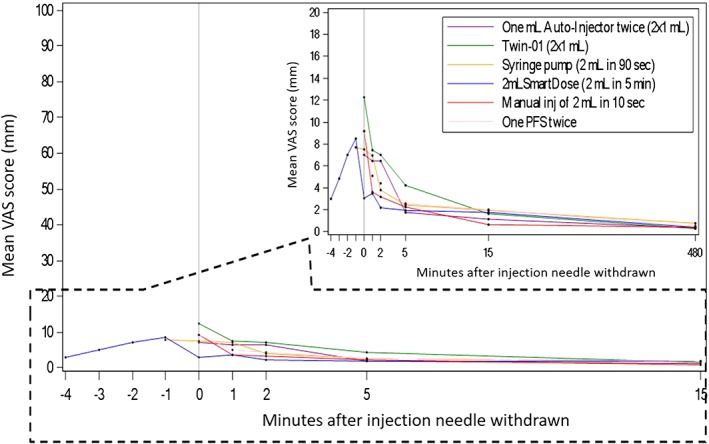
Figure 2.

Arithmetic mean visual analogue scale (VAS) pain score–time profiles per treatment group (PD analysis set). Standard deviations of mean VAS scores are mostly in the same order of magnitude for all devices. They are not included in the plot to keep time‐mean VAS scores clearly distinguishable. PFS, prefilled syringe
