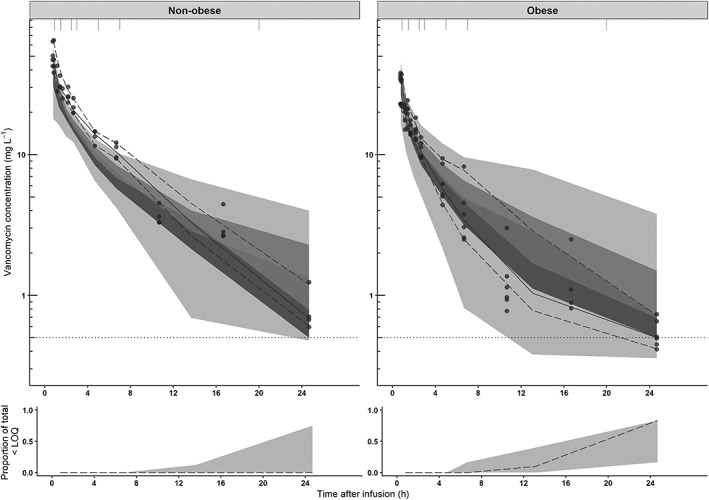
Figure 2.

Prediction‐corrected visual predictive checks (pcVPC) of the final model split for nonobese (upper left panel) and obese (upper right panel) subgroups for the external dataset published by Blouin et al.21 The observed concentrations from the Blouin study are shown as black circles, median, 2.5th and 97.5th percentiles of the observed data are shown as solid, lower and upper dashed lines. Grey shaded areas represent the 95% confidence intervals of the median (dark grey) and 2.5th and 97.5th percentiles (light grey) of simulated concentrations (n = 1000) based on the original dataset. The lower limit of quantification (LOQ) is depicted by the dotted grey line. Intervals of the bins are shown by the vertical ticks on the top of the plot. Intervals of the bins are shown by the vertical ticks on the top of the plot. Lower panels show the observed proportion below the LOQ (dashed line), where shaded areas represent the 95% confidence intervals based on simulated concentrations (n = 1000)
