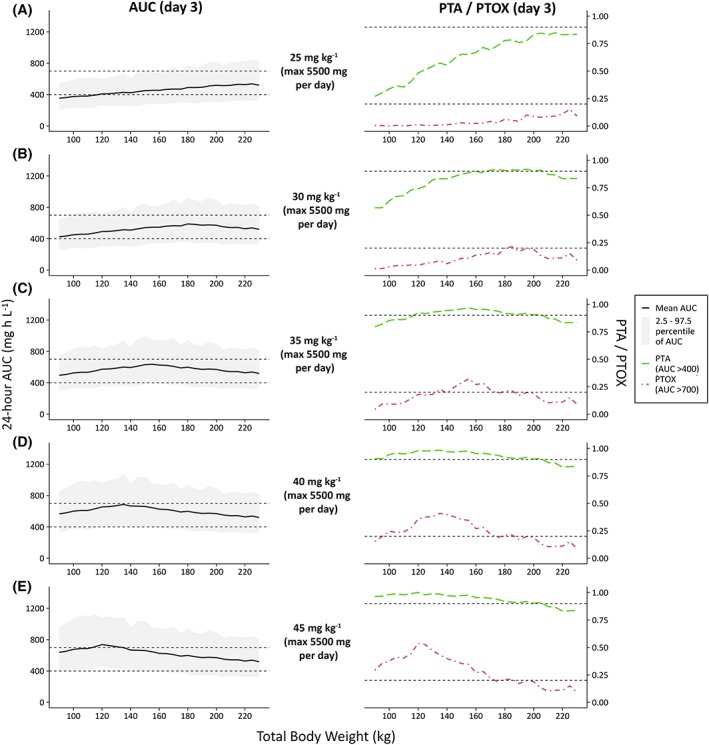
Figure 3.

Twenty‐four‐hour area under the curve (AUC) values at day 3 (left column) and probability of target attainment (PTA, AUC24h > 400) or toxicity (PTOX, AUC24h > 700) (right column), shown vs weight (90–230 kg) for several dose regimens (n = 10 000 per dose regimen). (A–E) Increasing dose regimens from 25 mg kg−1 day−1 to 45 mg kg−1 day−1, all maximized at 5500 mg day−1. In the left plots, the solid black line and grey area indicate mean observed AUC with 2.5–97.5 percentiles. Dashed grey line represents target AUC levels (400 and 700 mg h L−1). In the right plots, the dashed green line and dot‐dashed red line indicate PTA and PTOX, respectively. Dashed grey lines represent the threshold for PTA (0.9) and, for reference, 20% PTOX (0.2). AUC, 24 h area under the curve at day 3; PTA, probability of target attainment (AUC > 400 mg h L−1) at day 3; PTOX, probability of toxicity (AUC > 700 mg h L−1) at day 3
