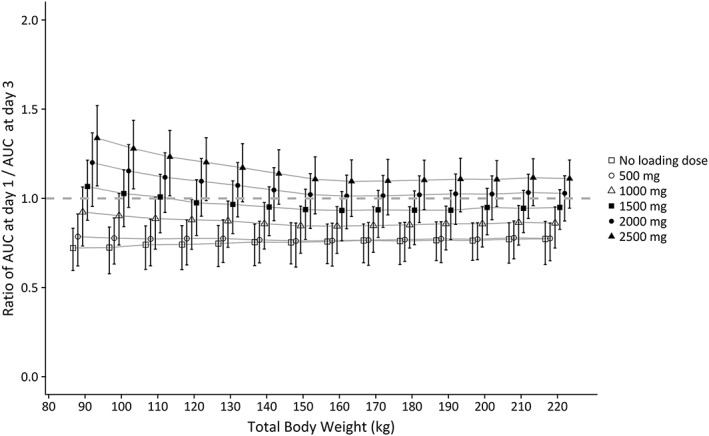
Figure 4.

Mean ratio of AUC24h at day 1/AUC24h at day 3 with 95% confidence intervals, shown for different loading doses vs body weight (90–230 kg), based on Monte Carlo simulations (n = 10 000 per loading dose). Each line represents 1 loading dose regimen. All individuals received 35 mg kg−1 continuous infusion started 2 h after the loading dose (maximised at 5500 mg day−1). Grey dashed line represents a ratio of 1.AUC, 24‐h area under the curve
