Figure A3.

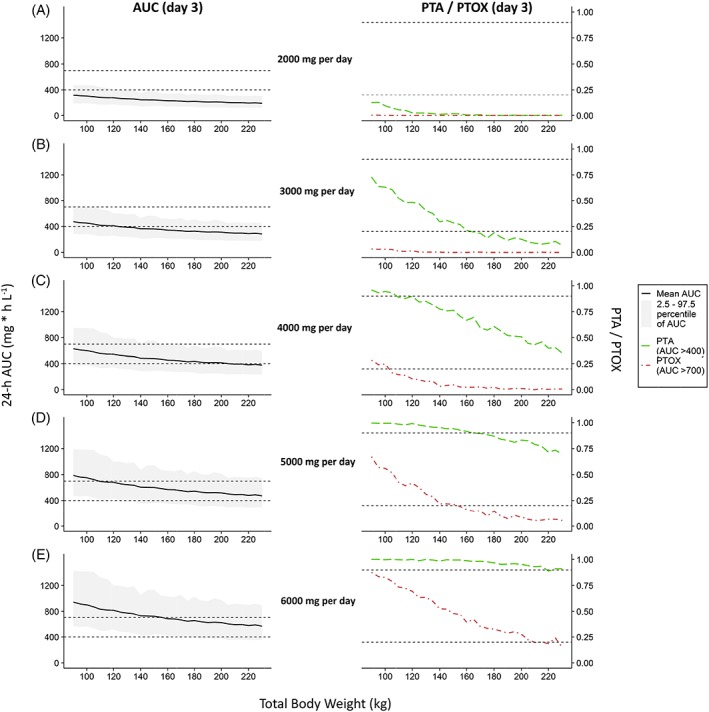
Simulation based comparison of 24‐h area under the curve (AUC) values at day 3 and probability of target attainment (PTA) or toxicity (PTOX) for fixed dose regimens

Simulation based comparison of 24‐h area under the curve (AUC) values at day 3 and probability of target attainment (PTA) or toxicity (PTOX) for fixed dose regimens