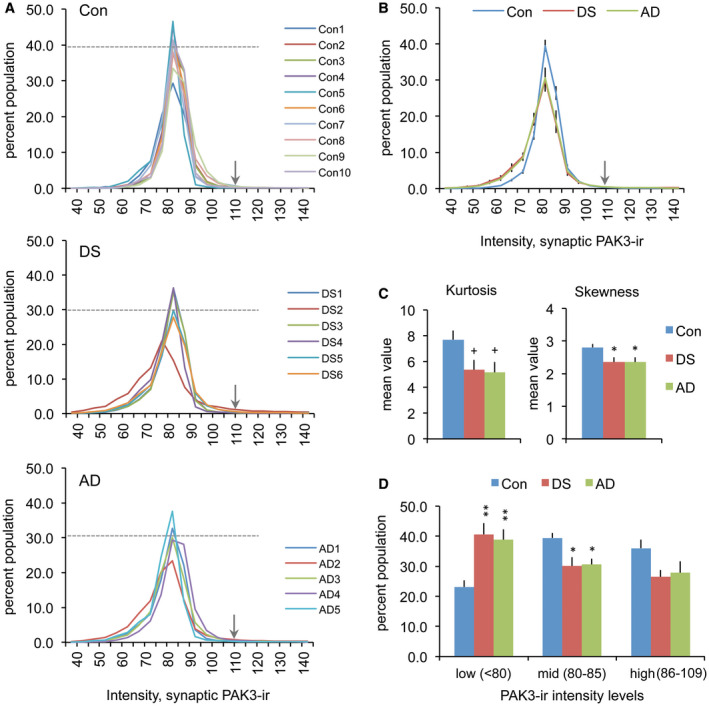
Figure 3.

Synaptic PAK3 levels are reduced in the DS and AD parietal cortex. (A) Synaptic immunolabeling intensity frequency distributions show the proportion of PSDs (Y‐axis) that were immunolabeled for PAK3 at different intensities (X‐axis) for the three groups. All cases in control (Con), DS and AD groups are shown individually. The dashed line in each plot indicates the mean percent of that group for which PAK3‐ir was at the 82.5 intensity level; arrows indicate the intensity threshold (110) that was used for cut‐off in statistical analyses in panels C and D. (B) Intensity frequency distributions for group mean values (±SEM). For DS and AD groups, there is a greater leftward skew in the distributions (towards lower intensities) and a lower proportion of synapses at the peak value relative to controls. (C) The bar graphs show the group mean kurtosis and skewness values (±SEM) for distributions presented in “A”. (Left: +P = 0.0538 for con vs. DS, +P = 0.0509 for con vs. AD, P = 0.0498 one‐way ANOVA. Right: *P < 0.05 vs. Con, P = 0.0202 one‐way ANOVA). (D) Bar graph shows that for DS and AD groups there are greater numbers of synapses with low density (<80) PAK3‐ir relative to the control group (Group means for low, mid, and high PAK3‐ir intensity levels shown; *P < 0.05, **P < 0.01 vs. Con).
