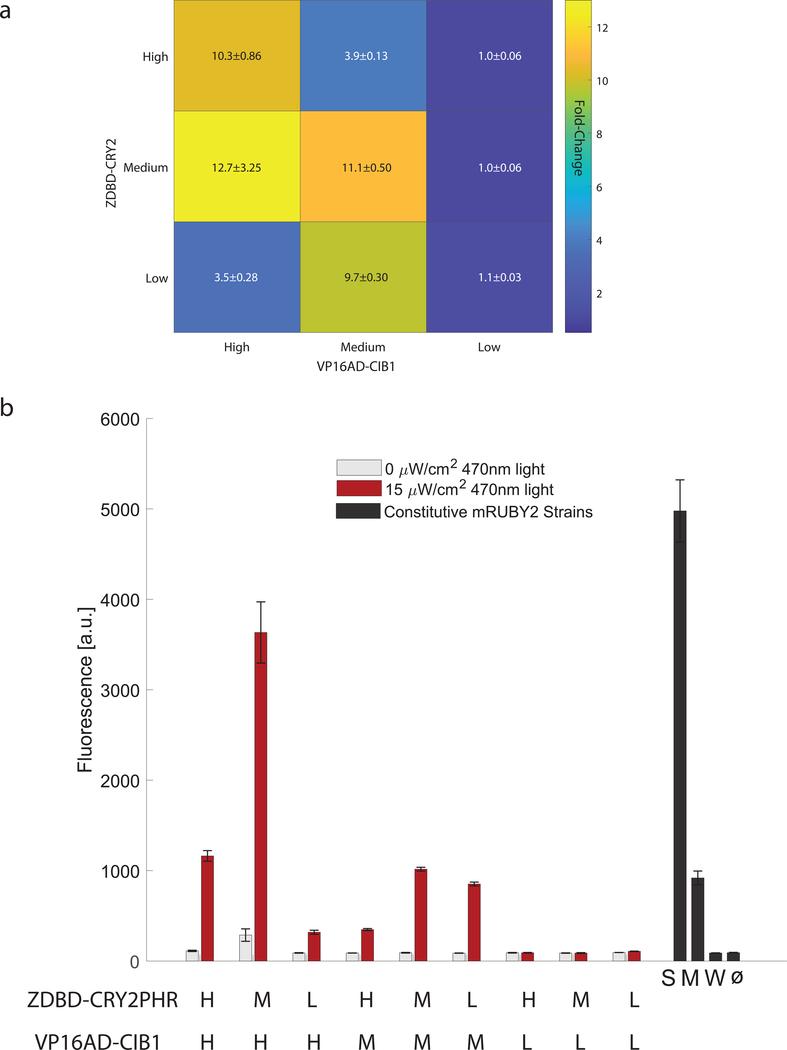
Figure 3. Optimization of the split transcription factor.
(A) Fold-induction in gene expression in response to 17 hours of 470nm 15μW/cm2 blue-light from the pZF(3BS)-mRuby2 reporter was measured in nine strains expressing different ratios of the DNA-binding domain (ZDBD-CRY2PHR) and the activation domain (VP16AD-CIB1) under High (pTEF1), Medium (pRPL18B), or Low (pRNR2) strength promoters to create ZDBD-CRY2high/med/low/VP16AD-CIB1high/med/low strains. Data is presented as mean±SEM. A one-way ANOVA (F(8,45)=30.04, p=1.35X10⁻¹⁵), followed by Tukey’s-HSD shows that the fold-changes are significantly different with the following groups (ZDBD-CRY2high/med/low/VP16AD-CIB1high/med/low): M/H-a; H/H, M/M, M/L-b; H/L, M/H-c; L/H, L/M, L/L-d. (B) Raw fluorescence data for strains shown in (A). Gene expression was compared to yeast strains expressing mRuby2 under constitutive promoters of different strengths (Strong-pTDH3, Medium-pRPL18B, Weak-pREV1). All constructs except those with the Low activation domain show very significant induction in the light (p<0.0001, Welch’s t-test). ANOVA followed by Tukey’s HSD (F(12,65)=248, p=2.21×10−49) shows that the following promoters or split TF combinations are significantly different: pTDH3 alone, M/H alone, the group containing H/H, M/M, L/M, pRPL18B, and the group containing L/H and H/M. All other lowly expressing promoters including the weak constitutive pREV1 promoter belong to the same group.

