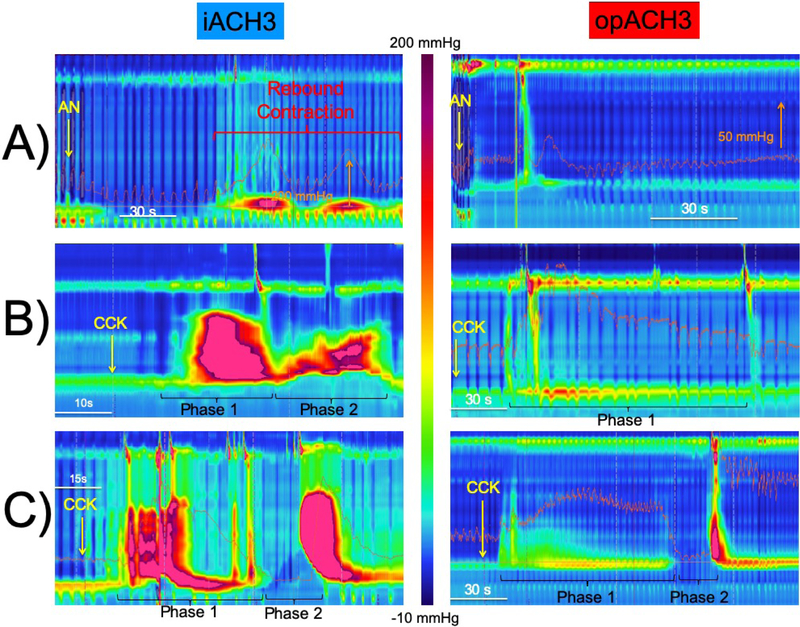
Figure-1. Representative esophageal pressure topography plots following amyl nitrite and cholecystokinin administration in idiopathic (IA3) and opioid-induced (OA3) type three achalasia patients.
A) Note the dramatic rebound esophagogastric junction (EGJ) contraction observed in IA3 patients and its absence in OA3 patients. B) The middle IA3 example shows dramatic esophageal and EGJ contraction during both phases of the CCK response. OA3, on the other hand, shows an attenuated phase-1 CCK contractile response with absent phase-2 component. C) The bottom example shows that all phase-2 responses, when present, had a normal LES relaxations in OA3 patients. Note the greater phase-2 DCI in IA3 than OA3. IA3 showed normal phase-2 relaxation, which was observed in a small minority of these patients.

