
Figure 2.
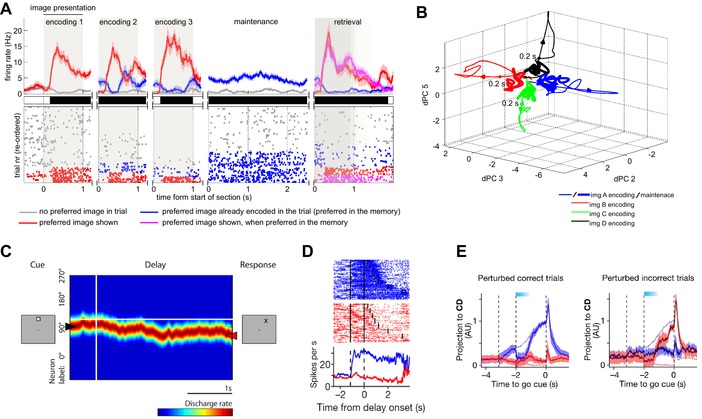
Persistent activity represented by attractor dynamic. (A) Example of a persistently active concept cell recorded in the human amygdala. Subjects memorized up to three images presented sequentially (encoding 1–3). Top: post stimulus time histogram. Middle: periods of significance (black) between the preferred versus nonpreferred stimuli of this cell. Bottom: raster plot of trials reordered according to condition. During maintenance, the activity of this cell is characterized by sustained activity only when the preferred image of the cell is held in memory (blue) but not when other stimuli are held in memory (gray). Adapted from Ref. 17. (B) Trajectories in neural state space formed by a population of persistently active concept cells in the human MTL. Trajectories are projected into the 3D space formed by the three demixed principal components (dPCs) associated with picture identity. Periods of time shown are encoding (thin line) and maintenance (thick line). Colors mark different images. Note how during maintenance, activity settles at points in space that separate by memory content (attractors). Adapted from Ref. 17. (C) Neuron whose activity is indicative of a continuous attractor during a delayed oculomotor task in rhesus monkey. Firing rate of stimulus‐selective neurons is sorted vertically according to preferred location. Note how activity drifts away from the initial position (left) as time progresses. This drift predicts behavioral errors (right). Adapted from Ref. 50. (D) Persistent activity recorded in mouse ALM during a task with variable delay durations. Blue color marks prefered location. (E) Population activity in mouse ALM shows characteristic of a discrete attractor. Shown is a projection of the population activity onto the axis that maximally distinguishing between the two possible conditions (left or right). Blue color (left panel) denotes correct lick‐right trials, and red denotes correct lick‐left trials. Dark blue and dark red (right panel) denote incorrect lick‐right and lick‐left trials, respectively. Dashed lines denote trajectories of unperturbed correct trials, whereas solid lines denote perturbed trials. Light blue band on the top shows time of photoinhibition. Note how the neural activity after offset of inhibition is pulled toward one of the two possible trajectories, as expected from an attractor. Adapted from Ref. 7.