Figure 2.
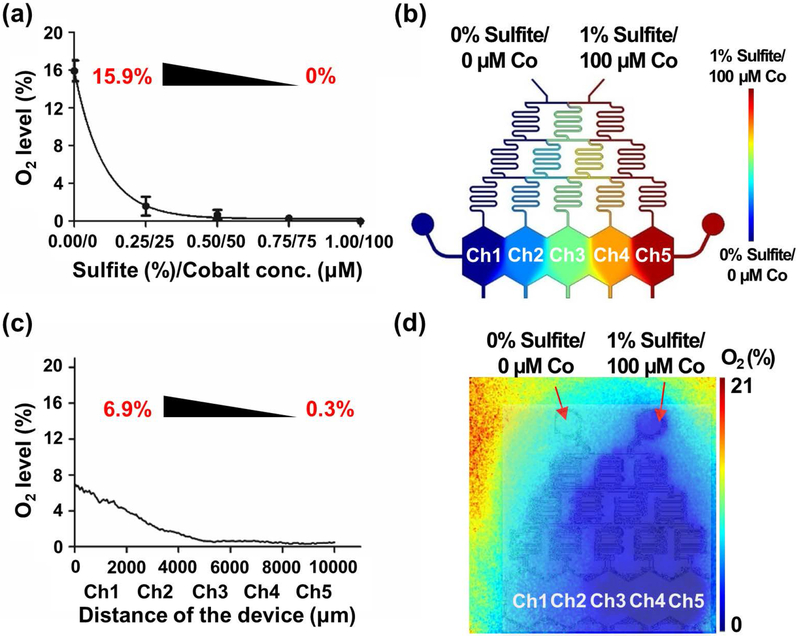
Oxygen gradient in the MPOC device. (a) The plot of measured oxygen levels versus varying sulfite and cobalt concentrations in the water where an oxygen range of 15.9%-0% was obtained. The measurements were performed in 50 mL conical tubes. (b) Simulation of the oxygen gradient by COMSOL Multiphysics. (c) Plotted steady-state oxygen gradient profile of the MPOC device after perfusion with 0% sulfite/0 μM cobalt and 1% sulfite/100 μM cobalt, showing a gradient of 6.9%-0.3% O2. (d) Representative oxygen profile in the MPOC device measured by the Presens system. Inlet 1: 0% sulfite/0 μM cobalt and inlet 2: 1% sulfite/100 μM cobalt. All data were obtained from at least three different experiments.

