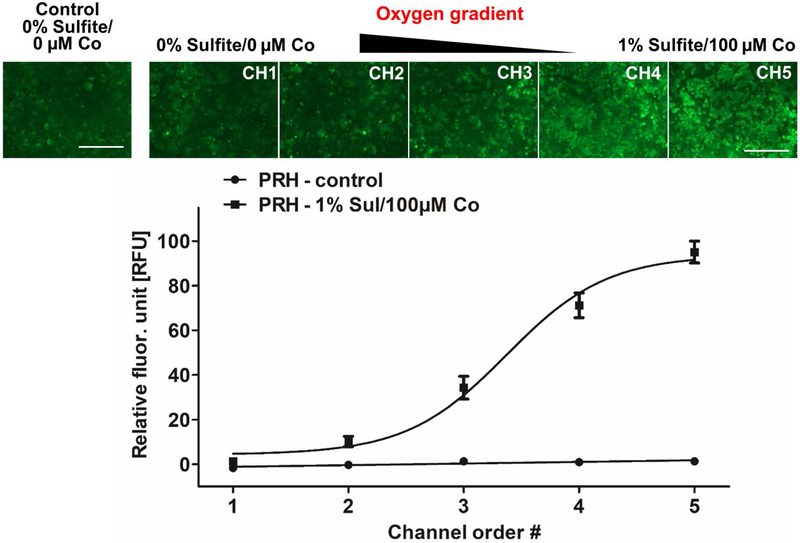
Figure 5.
ROS generation of primary rat hepatocytes in response to the hypoxia gradient in the MPOC device. Following perfusion with the oxygen gradient generated by 0% sulfite/0 μM cobalt and 1% sulfite/100 μM cobalt, cells were stained with CM-H2DCFDA to detect ROS levels. An increasing pattern of ROS accumulation was observed along the hypoxia gradient across the width of the device. Control groups consisted of cells perfused with DMEM media only. Image quantification was performed using ImageJ software. All data met p < 0.05 except that control vs channel 1; and channel 1 vs channel 2 are not significant (one way ANOVA n=10, Tukey’s test). Scale bar: 400 μm.

