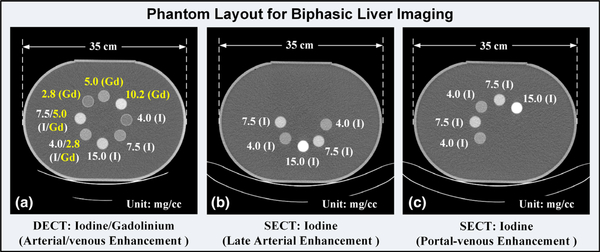
Fig. 3.
Sample computed tomography (CT) images showing the phantom layout for biphasic liver imaging: (a) mixed iodine and gadolinium samples with iodine contrast enhancement values corresponding to the late arterial phase and gadolinium to the portal-venous phase in the dual energy CT protocol, (b) one set of iodine samples corresponding to the late arterial phase enhancement in the single energy CT (SECT) protocol, and (c) the other set of iodine samples corresponding to the portal-venous phase in the SECT protocol.

