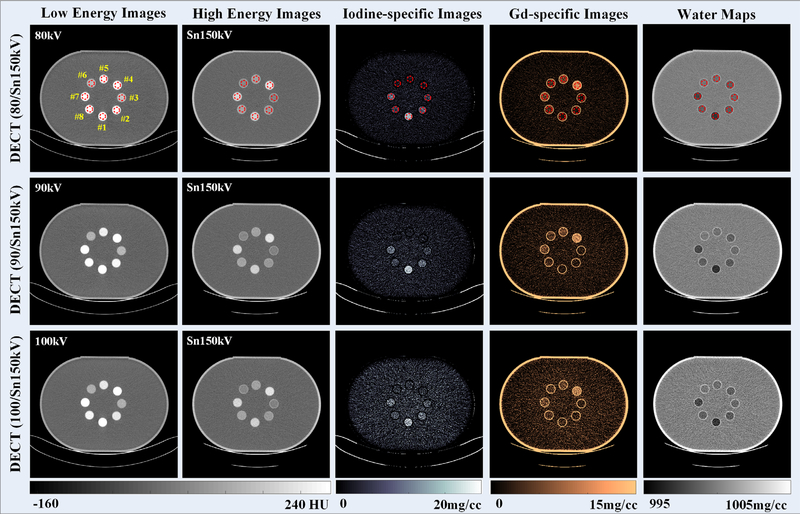
Fig. 6.
Computed tomography images reconstructed from low-energy (first column) and high-energy (second column) x-ray beams; iodine-specific images (third column), gadolinium-specific images (fourth column), and water maps (fifth column); of note, the window/level was 10/1000 mg/cc for water maps to reflect the subtle density variations in contrast sample areas when they are removed.

