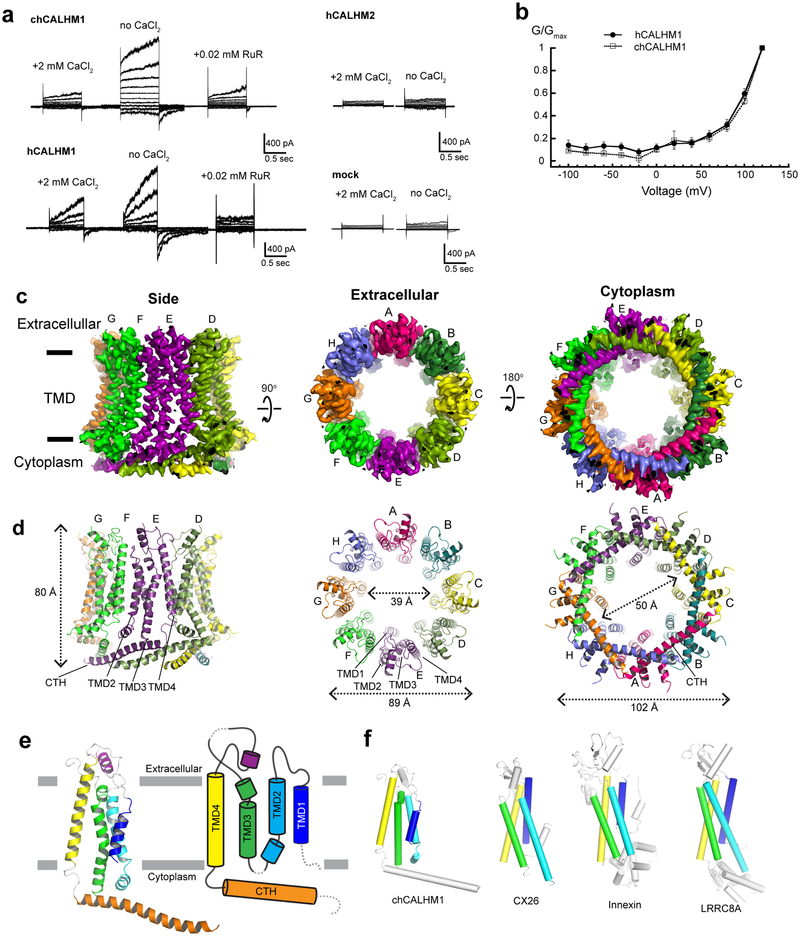
Fig. 1. Structure and function of chCALHM1.
a, Currents elicited by hCALHM1 and chCALHM1 with voltage steps from −100 to +100 mV in 10 mV increment in the presence and absence of extracellular calcium. The current of chCALHM1 can be blocked by 0.02 mM ruthenium red (RuR) as previously shown for hCALHM1. No significant voltage-dependent current compared to mock transfected cells were observed for hCALHM2 consistent with the previous report8. b, G-V plot of chCALHM1 and hCALHM1 with no CaCl2 (right panel). Error bars represent SEM for six individual patches (n=6) for hCALHM1 and seven (n=7) for chCALHM1). c-d, Cryo-EM density (c) and atomic models (d) of chCALHM1 viewed from the side of the membrane, the extracellular region, and the cytoplasm. e, Ribbon (left) and schematic (right) representations of the chCALHM1 protomer. The TMDs are colored as blue, cyan, green, and yellow for TMD1, 2, 3, and 4, respectively. Dashed lines represent regions that are not visible in our structure. f, Protomers of chCALHM1, CX2620, innexin17, and LRRC8A21. The TMDs are colored as in panel e for comparison. Data for the graphs in panel b are available as source data.

