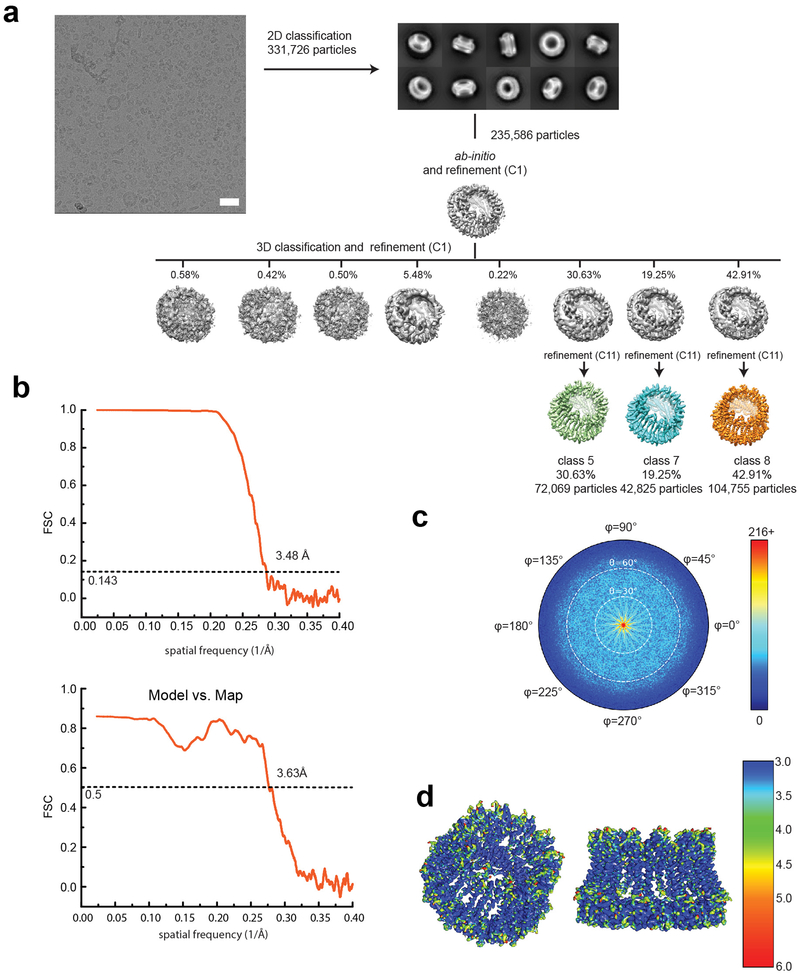
Extended Data Fig. 5. Single particle analysis of hCALHM2.
a, A representative micrograph (scale bar = 38.8 nm), representative 2D class averages, and the 3D classification workflow are shown. b, The FSC plots of the two half maps (top) and the map vs. model (bottom) are shown for class 8. c, The angular distribution plot for class 8. d, Local resolutions of class 8 were calculated using ResMap.

