
Figure 2.
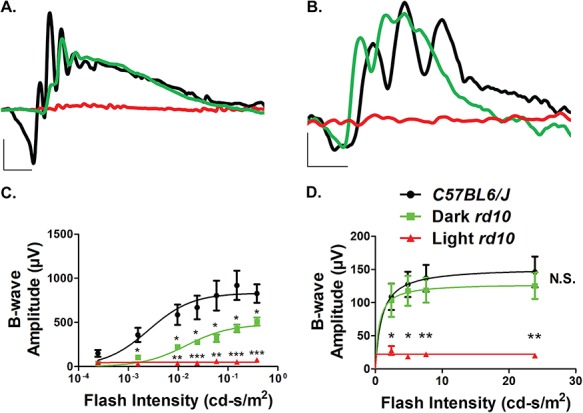
Preservation of retinal function in dark reared rd10 mice. (A) Representative scotopic (0.151 cd-s/m2) ERGs of the standard light (red) and dark (green) reared rd10 mice at PN45 along with age-matched C57BL6/J controls (black) after overnight dark adaptation (Scotopic scale bar: x-axis = 20 ms, y-axis = 200 μV). (B) Representative photopic (7.6 cd-s/m2) ERGs of the standard light (red) and dark (green) reared rd10 mice along with age-matched C57BL6/J controls (black) under light-adapted conditions using a 30 cd-s/m2 rod-saturating white background light at PN45 (Photopic scale bar: x-axis = 20 ms, y-axis = 40 μV). (C) Light stimulus intensity plot of the scotopic ‘b’-wave response from the standard light and dark reared rd10 mice along with age-matched C57BL6/J controls at PN45 (n = 3). The dose response relationship was modeled using the Naka-Rushton fit with maximum amplitudes determined to be 833 ± 64, 479 ± 31 and 50 ± 5 μV for the wild-type, dark and light reared rd10 mice, respectively. (D) Light stimulus intensity plot of the photopic ‘b’-wave response from the dark and standard light reared rd10 mice along with age-matched C57BL6/J controls at PN45 (n = 3). The dose response relationship was modeled using the Naka-Rushton fit with maximum amplitudes determined to be 153 ± 20, 129 ± 19 and 22 ± 4 μV for the wild-type, dark and light reared rd10 mice, respectively. Data are shown as the mean ± SEM with statistical significance calculated using the two-tailed homoscedastic unpaired student’s t-test (*P < 0.05; **P < 0.01; ***P < 0.001).