
Figure 1.
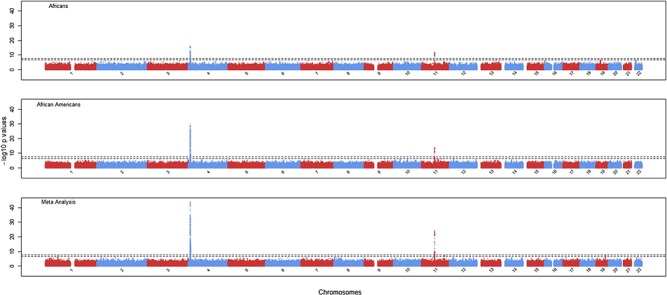
GWAS Manhattan plots for Africans (n = 4126, top panel), African Americans (n = 5007, middle panel) and meta-analysis (n = 9133, bottom panel). The two dotted lines represent genome-wide significance at −log10 (5 × 10⁻⁸) and genome-wide suggested significance at −log10 (5 × 10⁻⁷), respectively.