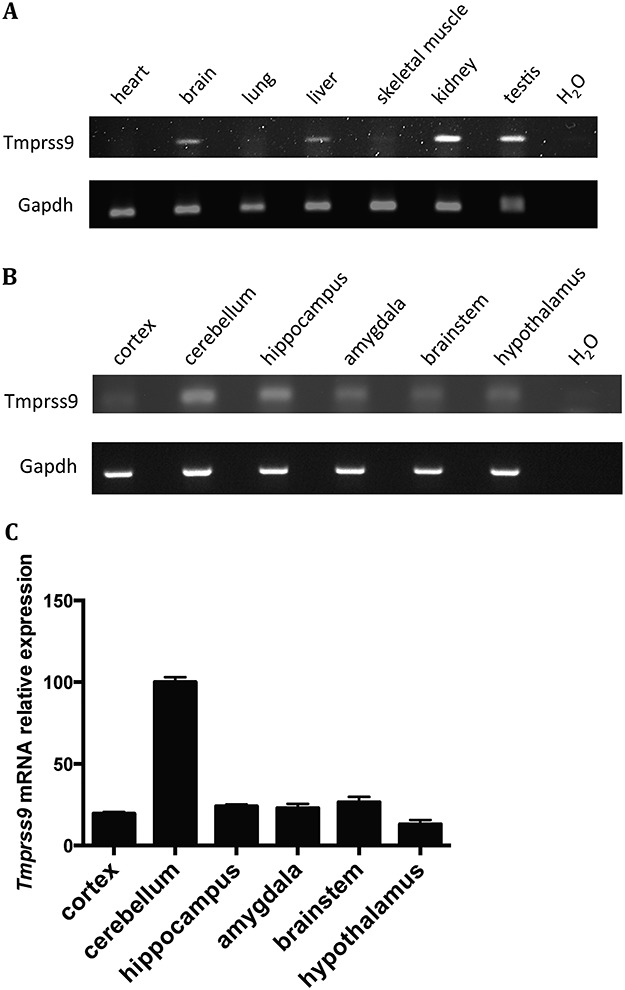
Figure 3.

Tmprss9 expression in mouse tissues and specific brain regions. (A) Semiquantitative PCR of Tmprss9 mRNA in multiple tissues in wild-type mice. (B) Semiquantitative PCR of Tmprss9 mRNA in multiple brain regions in wild-type mice. (C) Quantitative RT-PCR of Tmprss9 mRNA expression in various brain regions. Data are normalized to Rps16 mRNA levels. Data are shown as mean ± standard error of mean (N = 2).
