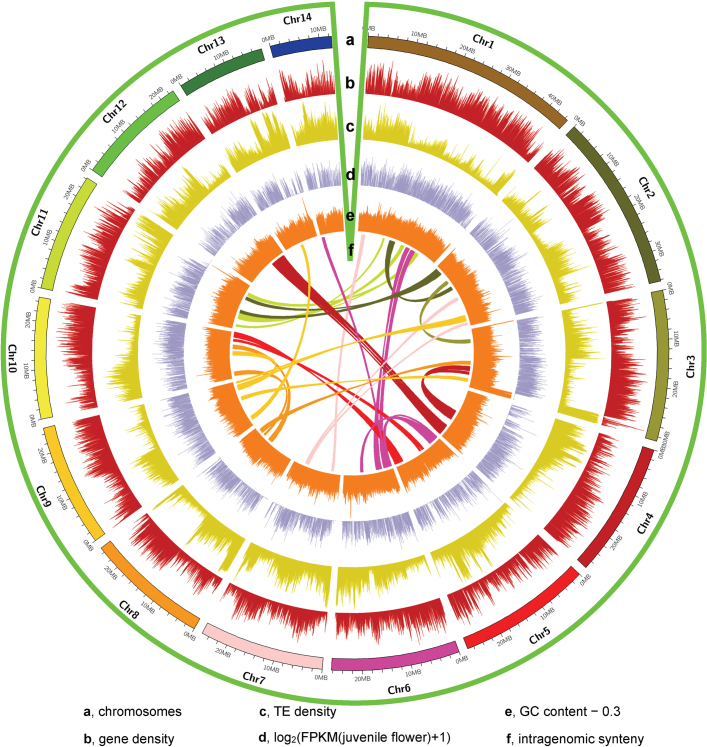
Extended Data Fig. 1. High-quality genome of N. colorata allows integration of genetic and expression data.
a, The assembled 14 chromosomes. b, Gene density plotted in a 100-kb sliding window. c, Transposable element (TE) density plotted in a 100-kb sliding window. d, Gene expression atlas of the juvenile flower, expression values were transformed with log2(FPKM + 1). e, GC content plotted in a 100-kb sliding window. f, Intragenomic syntenic regions denoted by a single line represent a genomic syntenic region covering at least 20 paralogues.

