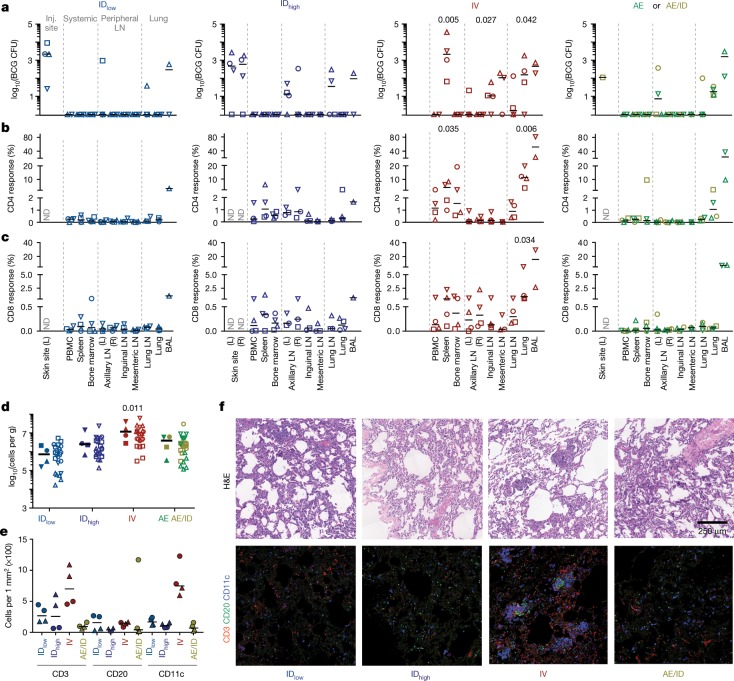
Fig. 3. BCG CFUs and immune responses in tissues one month after BCG immunization.
NHPs (cohorts 5a–c: IDlow, IDhigh and IV, n = 4 NHPs; AE and AE/ID, n = 2 NHPs) were euthanized one month after vaccination to quantify BCG and T cell responses in tissues. a, BCG CFUs at vaccination site(s) (skin, ID only) and in various tissues (per ml blood or bone marrow; per whole spleen, LN or lung lobe; or per total BAL collected). L, left; R, right; ND, not determined. b, c, Frequency of memory CD4 (b) and CD8 (c) T cells producing IFNγ, IL-2, TNF or IL-17 after PPD stimulation. Matched symbols within each vaccine group are the same macaque. Kruskal–Wallis tests were run and reported P values represent Dunn’s multiple comparison test comparing each group to the IDlow group. d, Total viable cells per gram of lung tissue for each vaccine regimen; data are shown as the median of four macaques per group (solid symbols, six lung lobes from each NHP are averaged) or as counts for each lung lobe (n = 24 lobes) from all NHPs (open symbols with lobes from same macaque matched). Kruskal–Wallis test was run on medians; Dunn’s adjusted P values are from comparing each group to the IDlow group. e, Quantification of CD3+, CD20+ and CD11c+ cells from two lung sections per NHP (matched symbols, n = 2 macaques). f, Representative (one out of four) 1 mm2 lung sections from each BCG regimen stained with haematoxylin and eosin (H&E; top) or with antibodies against CD3+ T cells (red), CD20+ B cells (green), and CD11c+ macrophages or dendritic cells (blue).

