FIGURE 7.
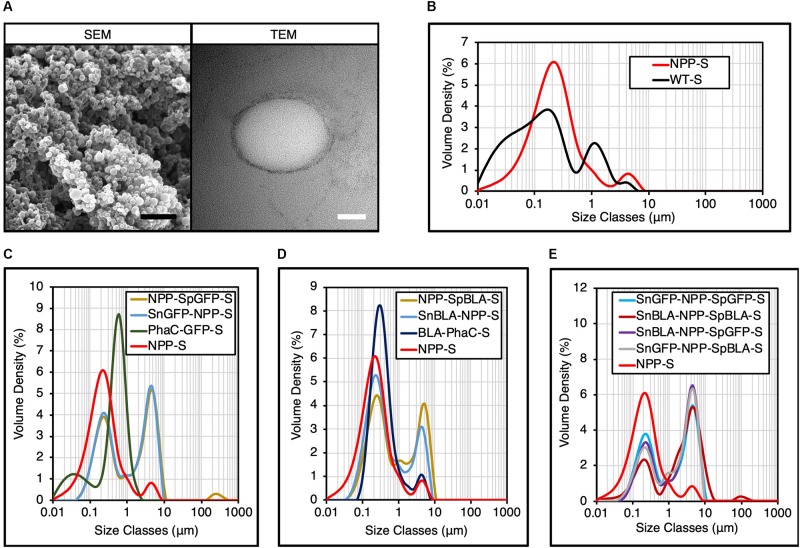
Structural characterization of various NPP-Ss. (A) SEM and TEM micrographs of plain NPP-S. Black scale bar, 1 μm; white scale bar, 100 nm. (B) Particle size distribution of plain NPP-S by DLS analysis (mean, n = 3). (C) Particle size distribution of SpGFP-H6 and SnGFP-H6 immobilized NPP-Ss by DLS analysis (mean, n = 3) using particle size distribution of plain NPP-S determined in B as negative control and PhaC-GFP-S as positive control. (D) Particle size distribution of SpBLA-H6 and SnBLA-H6 immobilized NPP-Ss by DLS analysis (mean, n = 3) using particle size distribution of plain NPP-S determined in B as negative control and BLA-PhaC-S as positive control. (E) Particle size distribution of various dual-functionalized NPP-Ss by DLS analysis (mean, n = 3) using particle size distribution of plain NPP-S determined in B as negative control. NPP-S, NPP fusion protein-displaying PHA spheres; WT-S, WT-displaying PHA spheres; NPP-SpGFP-S, NPP-SpGFP ligated protein-displaying PHA spheres; SnGFP-NPP-S, SnGFP-NPP ligated protein-displaying PHA spheres; PhaC-GFP-S, PhaC-GFP fusion protein-displaying PHA spheres; NPP-SpBLA-S, NPP-SpBLA ligated protein-displaying PHA spheres; SnBLA-NPP-S, SnBLA-NPP ligated protein-displaying PHA spheres; BLA-PhaC-S, BLA-PhaC fusion protein-displaying PHA spheres; SnGFP-NPP-SpGFP-S, SnGFP-NPP-SpGFP ligated protein-displaying PHA spheres; SnBLA-NPP-SpBLA-S, SnBLA-NPP-SpBLA ligated protein-displaying PHA spheres; SnBLA-NPP-SpGFP-S, SnBLA-NPP-SpGFP ligated protein-displaying PHA spheres; SnGFP-NPP-SpBLA-S, SnGFP-NPP-SpBLA ligated protein-displaying PHA spheres.

