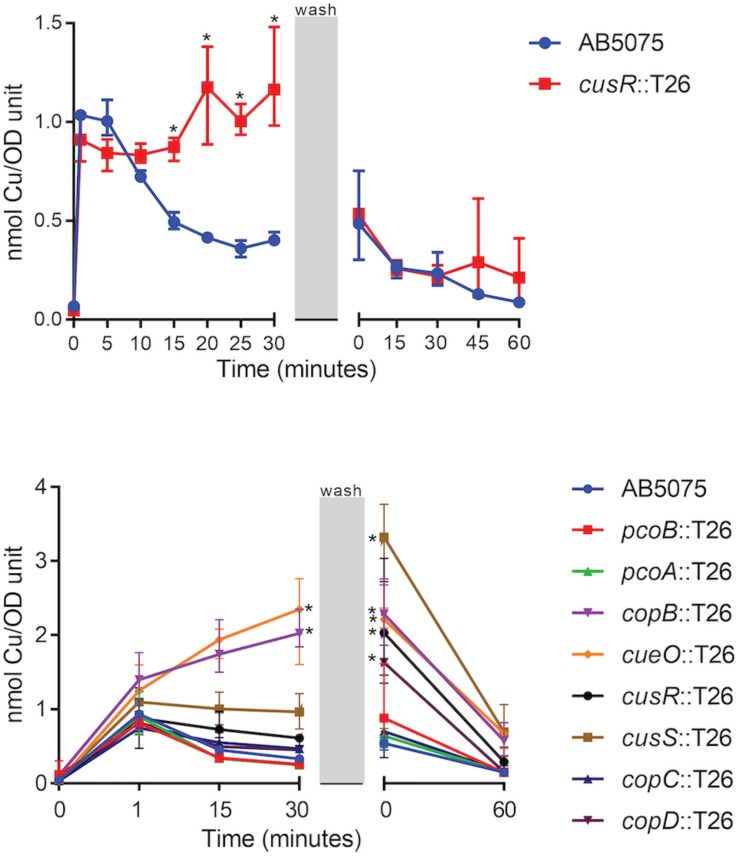
FIGURE 6.
Accumulation of intracellular copper. Log phase cultures were treated with 0.25 mM CuSO4 and samples were collected at the indicated timepoints. During the wash phase, the remaining culture volume was washed and resuspended in fresh M9 medium without supplemented copper. Cell samples that were collected at each timepoint were washed and dried, and copper content was measured by ICP-MS. Data are presented as the mean and range for three biologically independent experiments. Two-way ANOVA with Sidak’s correction was used to compare the cusR mutant strain to the wild-type at all timepoints (top); two-way ANOVA with Dunnett’s correction was used to compare all the mutant strains to wild-type at all timepoints (bottom). Statistically significant comparisons are indicated with an asterisk (P < 0.01). At 0 min post-wash, five strains were significantly different from wild-type: copB, cueO, cusR, cusS, and copD (bottom).

