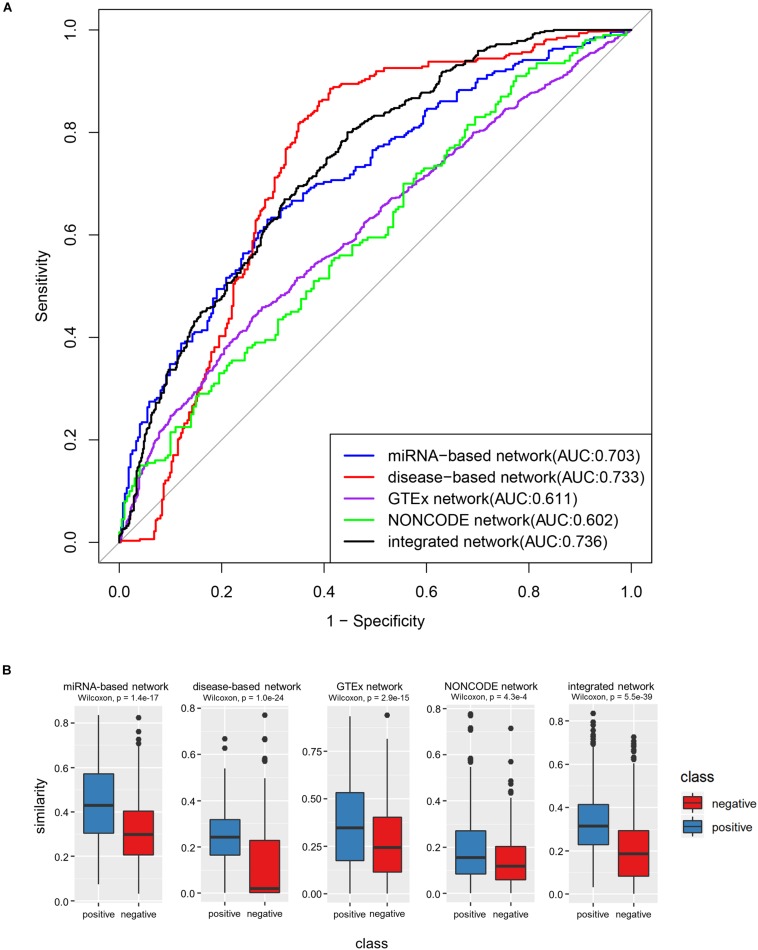
FIGURE 5.
The performance of integrated similarity to discriminate lncRNA pairs with shared target mRNAs. (A) ROC curves of four single networks and integrated network. (B) Box-plot comparing the similarities among lncRNAs with shared target mRNAs (positive samples) and those without (negative samples). The p-values were derived via Wilcoxon test.

