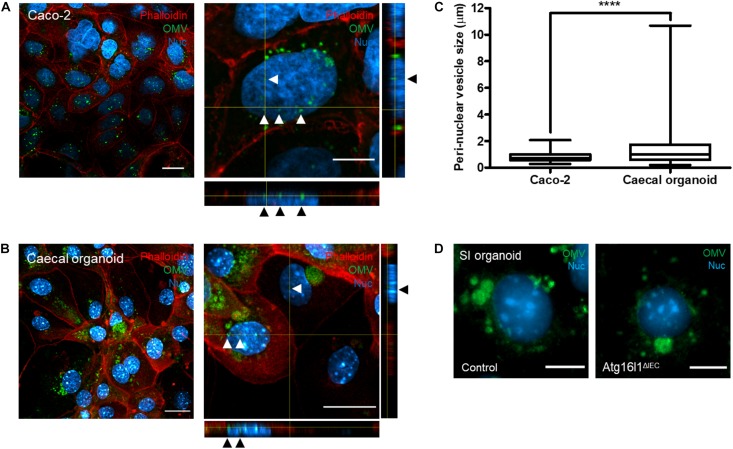
FIGURE 5.
Localization of Bt OMVs to a peri-nuclear membrane. (A) Caco-2 cell monolayers and (B) caecal organoid epithelial monolayers were incubated with DiO-OMVs for 24 h and stained with phalloidin to visualize the apical membrane and the nuclear stain Hoechst 33342 prior to imaging by confocal microscopy. The main panels depict merged XY images with the side panels showing XZ and XY orthogonal views. Arrow heads indicate peri-nuclear localization of OMVs. Images are representative of more than three independent experiments. Scale bars = 20 μm. (C) Quantification of the host peri-nuclear vesicle size was performed using the straight-line selection tool in Image J/FIJI v1.52p. The box plots depict mean ± SEM and the whiskers min–max values from more than three independent experiments with more than 200 vesicles quantified per group. (D) Primary SI epithelial organoid monolayers were generated from wild-type control (Left) or autophagy-deficient (Atg16l1ΔIEC) mice (Right) and incubated with DiO-OMVs as above and analyzed by fluorescence microscopy. The main panels depict merged images with the side panels showing the individual channels. Images are representative of more than three independent experiments. Scale bars = 20 μm. ****p < 0.0001.

