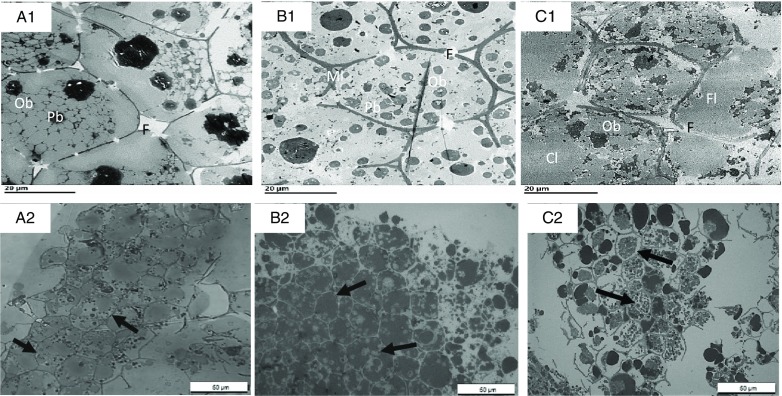
Fig. 6.
Transmission electron microscopy (TEM) (A1–C1) and light microscopy (LM) (A2–C2) micrographs of sections of nut tissues from walnuts (A1, A2), almonds (B1, B2) and pistachios (C1, C2) recovered after mastication. F, fissures; Ml, middle lamella; OB, oil body; Cl, coalesced lipid; Fl, free lipid. Arrows point to intact cells underneath the fractured layer of parenchyma tissue; note coalesced lipid (OB) from fractured cells and free lipid on the peripheral edge of the tissue. Scale bar A1–C2 = 20 µm; A2–C2 = 50 µm.

