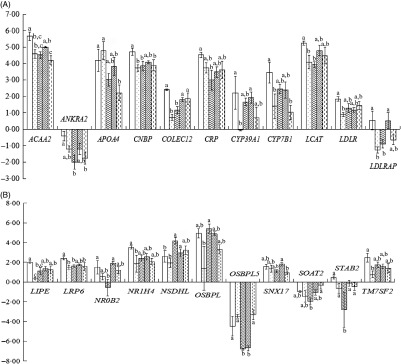
Fig. 1.
Liver-related gene expression in hyperglycaemic mice. (A) and (B) Liver-related gene expression. CK, standard diet + physiological saline of 5 g/kg per d (blank control); H, standard diet + physiological saline of 5 g/kg per d (experimental control group with induced diabetes); CP, standard diet + metformin HCl tablets of 125 mg/kg per d; LJ, standard diet + inulin of 2·5 g/kg per d; HJ, standard diet + inulin of 10 g/kg per d. a,b,c Mean values for a gene with unlike letters are significantly different (P < 0·05).  , CK;
, CK;  , H;
, H;  , CP;
, CP;  , LJ;
, LJ;  , HJ.
, HJ.

