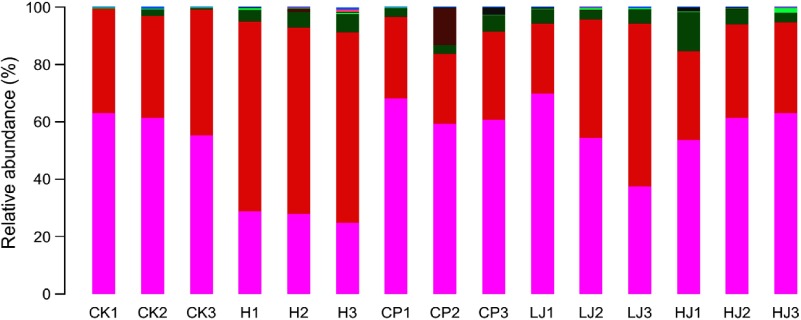
Fig. 3.
Relative abundance of the dominant bacterial phyla in mouse intestinal contents as influenced by the treatments. The relative abundances are based on the proportional frequencies of DNA sequences that could be classified at the phylum level. CK, standard diet + physiological saline of 5 g/kg per d (blank control); H, standard diet + physiological saline of 5 g/kg per d (experimental control group); CP, standard diet + metformin HCl tablets of 125 mg/kg per d; LJ, standard diet + inulin of 2·5 g/kg per d; HJ, standard diet + inulin of 10 g/kg per d.  , p__Bacteroidetes;
  , p__Firmicutes;
  , p__Proteobacteria;
  , p__Verrucomicrobia;
  , p__Actinobacteria;
  , p__Cyanobacteria;
  , p__Candidate_division_TM7;
  , other.

