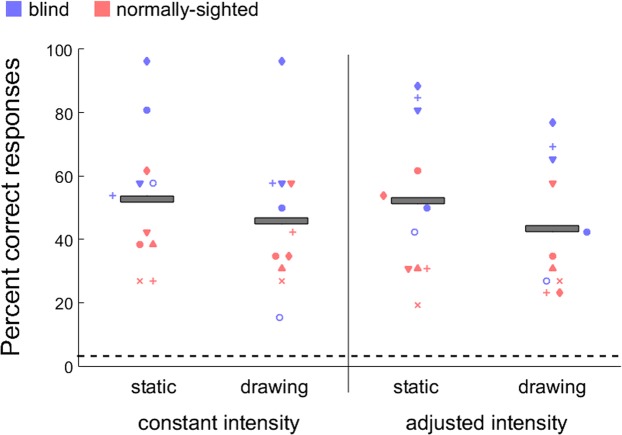
Figure 5.
Individual and mean (grey bars) percent correct responses for the letter recognition in static, and drawing conditions across constant and adjusted intensity experiments. Performance is well above chance (horizontal dashed line: 1/26) for all conditions and participants. There was no difference in recognition performance between constant and adjusted intensity experiments. Increasing intensity at the back of the tongue where sensitivity is lower did not improve the recognition performance.

