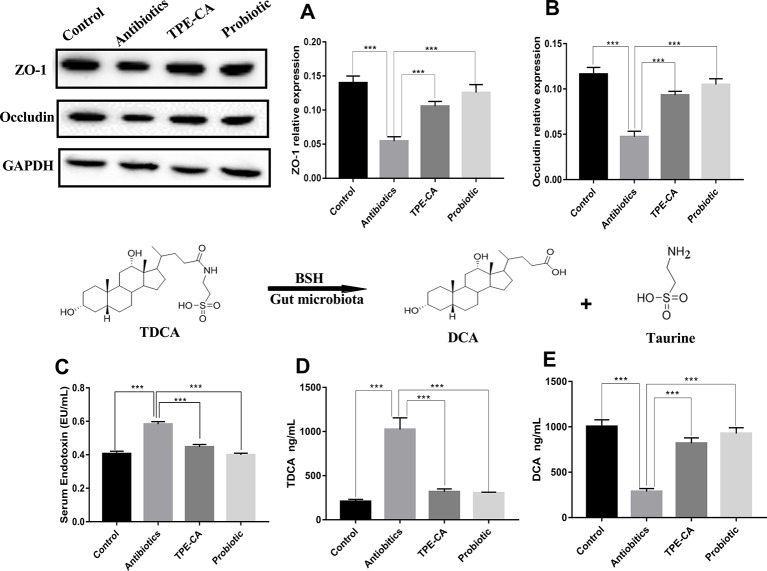
Figure 3.
Improvement of TPE-CA treatment on intestinal integrity and on BSH activity of antibiotics- induced mice.TPE-CA group and probiotic group. (A) The level of ZO-1 for four groups. (B) The level of occludin for four groups. (C) The level of endotoxin in serumr for control group, antibiotics group, (D) The level of TDCA for control group, antibiotics group, TPE-CA group and probiotic group. (E) The level of DCA for control group, antibiotics group, TPE-CA group and probiotic group. ***p < 0.001. Values are represented as means ± S.D for 10 animals per group.

