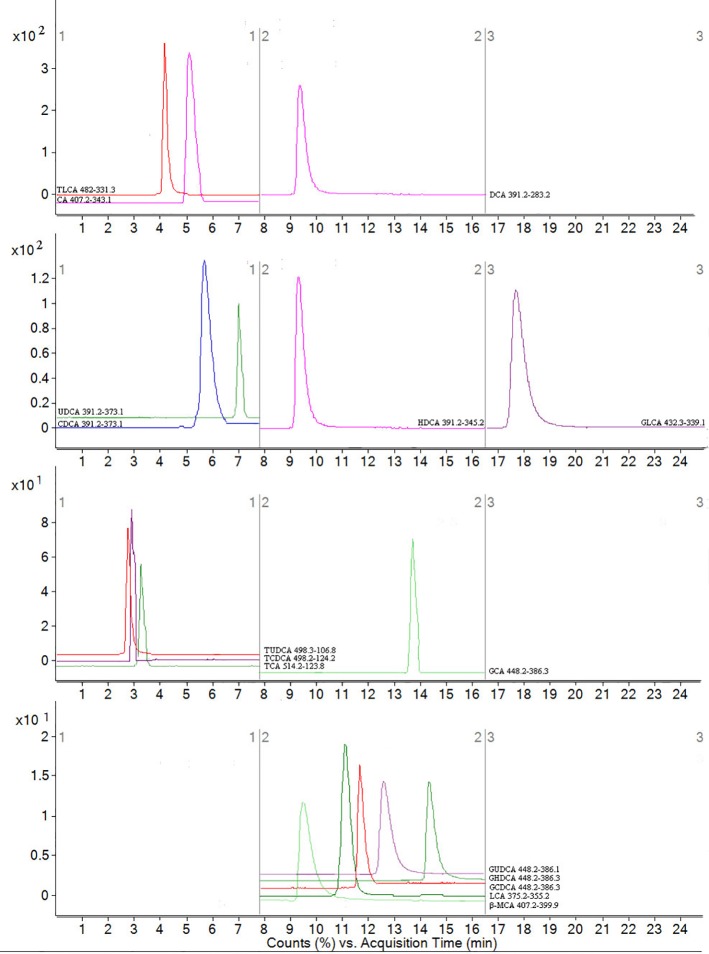
Figure 4.
MRM figure for 16 compounds in bile acids. The mass spectrometer was programmed to produce MS/MS spectra in negative ionization modes by ESI source. Scan width for MRM, MRM was performed by using mass transition between specific parent ions into corresponding fragment ions for each analyte. According to the retention time and peak area of each fragment ion, qualitative and quantitative analysis was carried out. The x-coordinate is time, and y-coordinate is the ion strength. 16 bile acids including CA, LCA, DCA, CDCA, β-MCA TCDCA, GCDCA, TCA, GCA, HDCA, GHDCA, TLCA, UDCA, TUDCA, GUDCA and GLCA.

