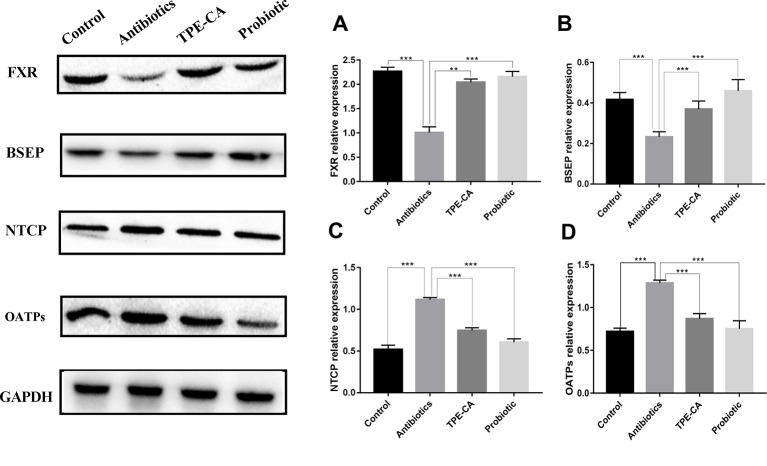
Figure 8.
Effect of TPE-CA on FXR-targeted protein. (A) The level of FXR in liver for four groups. (B) The level of BSEP for four groups. (C) The level of NTCP for four groups. (D) The level of OATPs for four groups. Expressions are normalized to GAPDH. **p < 0.01, ***p < 0.001. Values are represented as means ± S.D for 10 animals per group.

