Figure 3.
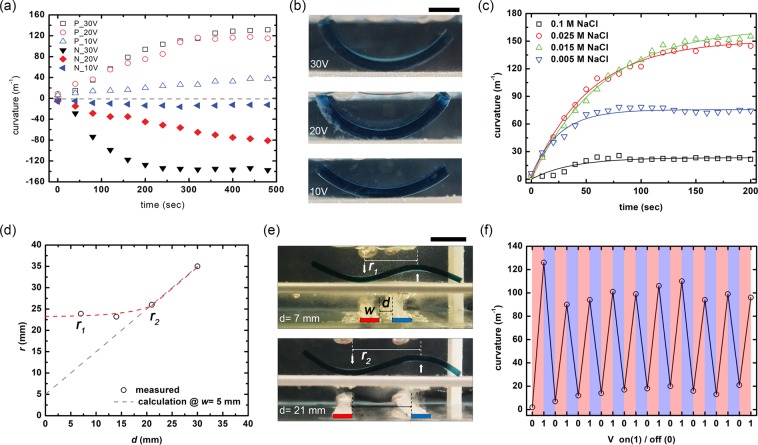
Electroactive hydrogel bending mechanics. (a) The curvature is plotted against the time of the applied electric field for three different values of voltage. Positive curvature indicates bending toward the upper electrode, and negative curvature indicates bending toward the lower electrode. (b) Images in a constant applied an electric field of 30, 20, and 10 V (Scale bar is 5 mm). (c) The bending curvatures in cases of 0.005, 0.015, 0.025, and 0.01 M NaCl. (d) The effective distance between the positive and negative curvatures according to the periodicity of the electric field is measured and plotted for the cantilever in (e). Here, r depicts the distance between two bending and the scale bar is 10 mm. (f) The curvature of the bend is found to be reproducible through multiple cycles of voltage on and off, as plotted for the single bending cantilever in (b).

