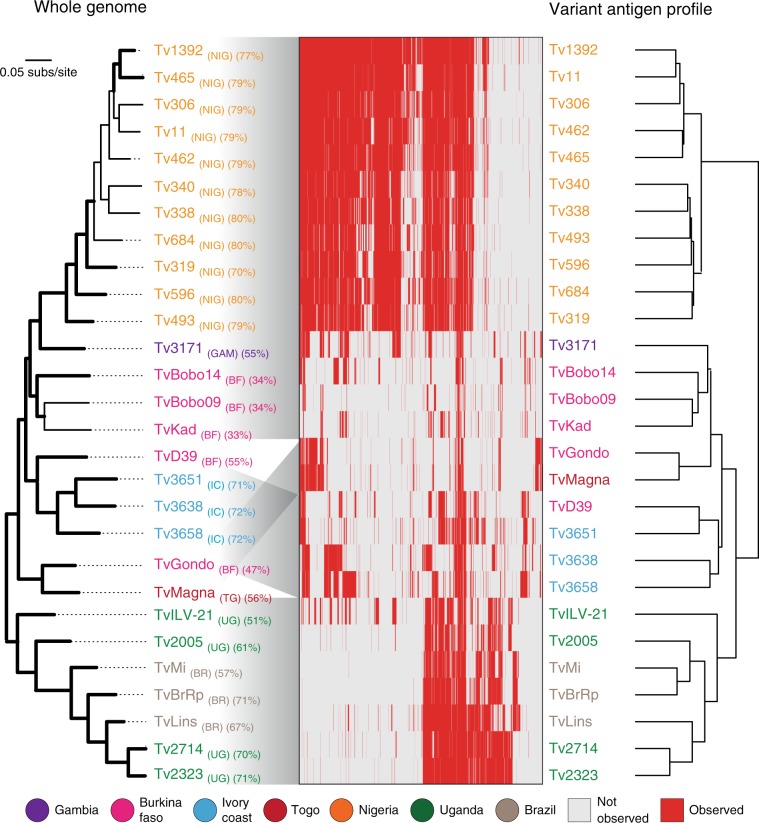
Fig. 1. Variant antigen profiles of T. vivax clinical isolates based on presence and absence of VSG gene clusters are concordant with population history (i.e. genetic relatedness).
On the left, a Maximum Likelihood phylogenetic tree estimated from a panel of 21,906 whole-genome SNPs using a GTR + Γ + I model. Branch support is provided by 100 bootstrap replicates and branches with bootstrap support >70 are shown in bold. Percentage genome coverage is shown for each strain in brackets following its label. Genome sequence reads for 28 T. vivax clinical strains were mapped to 2038 VSG type sequences, representing conserved clusters of orthologous genes (COGs) or strain-specific sequences, to determine the distribution of each VSG. Presence (red) or absence (white) of each VSG in each strain is indicated in the central panel. Each profile is labelled with the strain name, coloured by its geographical origin, and linked to the SNP tree by the grey shade. On the right, a dendrogram relating all strains according to their observed VSG repertoire was estimated from Euclidean distances between VAPs. Source data are provided as a Source Data file.

