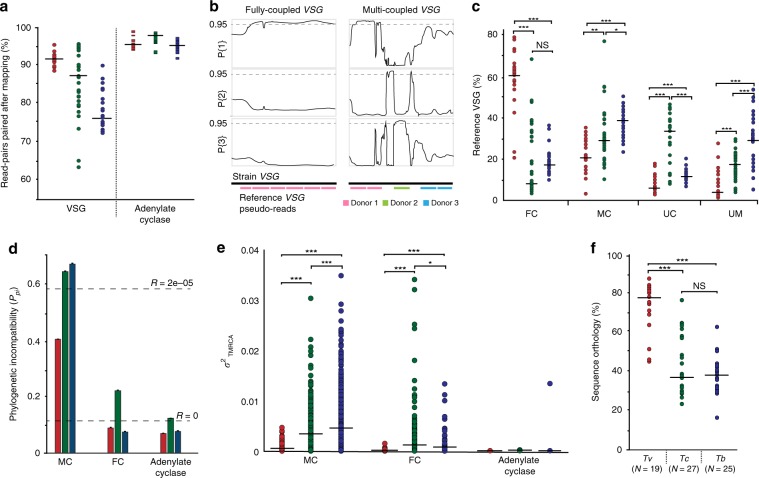
Fig. 3. The frequency of VSG recombination differs between African trypanosome species.
a The proportion of read-pairs from strain VSG remaining paired after being mapped to the reference sequence for each trypanosome genome, shaded by species. Adenylate cyclase genes (AC) were included as a negative control. b The definition of fully coupled (FC) and multi-coupled (MC) VSG sequences. Reference VSG sequences were segmented and mapped to strain VSGs. Where ≥85% of pseudo-reads map to the same locus (e.g. ‘Donor 1’), the gene is fully coupled. Where a strain VSG has multiple segments mapping to multiple locations (e.g. ‘Donor 1–3’), the gene is multi-coupled. Example T. brucei VSG sequence quartets are shown after TOPALi HMM analysis82 (see Methods). The three line graphs represent the Bayesian probabilities of three possible topologies for a quartet phylogeny. An FC VSG displays the same topology along its whole length. An MC VSG displays different phylogenetic signals along its length, dependent on the identity of the sequence donor. c A comparison of the proportions of FC, MC, uncoupled (UC) and unmapped (UM) VSG in each trypanosome species. The median value is shown as a black bar. Statistical significance of differences in the mean are indicated by asterisks (independent t test, *p < 0.05; **p < 0.01; ***p < 0.001). d Phylogenetic incompatibility among VSG genes using Phi23. The proportion of FC and MC VSG quartet alignments showing significant phylogenetic incompatibility (Ppi) in MC and FC VSGs is shown, shaded by species (mean ± s.e.m.). Observed Ppi values for simulated sequences generated by NetRecodon78, either with recombination (R = 2e−05) or without (R = 0), are indicated by dashed lines. e Variation in the ‘time to most recent common ancestor’ (TMCRA) along MC and FC VSG quartet alignments, estimated from ancestral recombination graphs constructed by ACG81. The median value is shown as a black bar. f Total sequence orthology among VSG repertoires in each species. Orthology was calculated as the proportion of VSG base-pairs fully coupled between each strain genome sequence and the reference. Number of strain genomes is shown in brackets. Source data are provided as a Source Data file.

