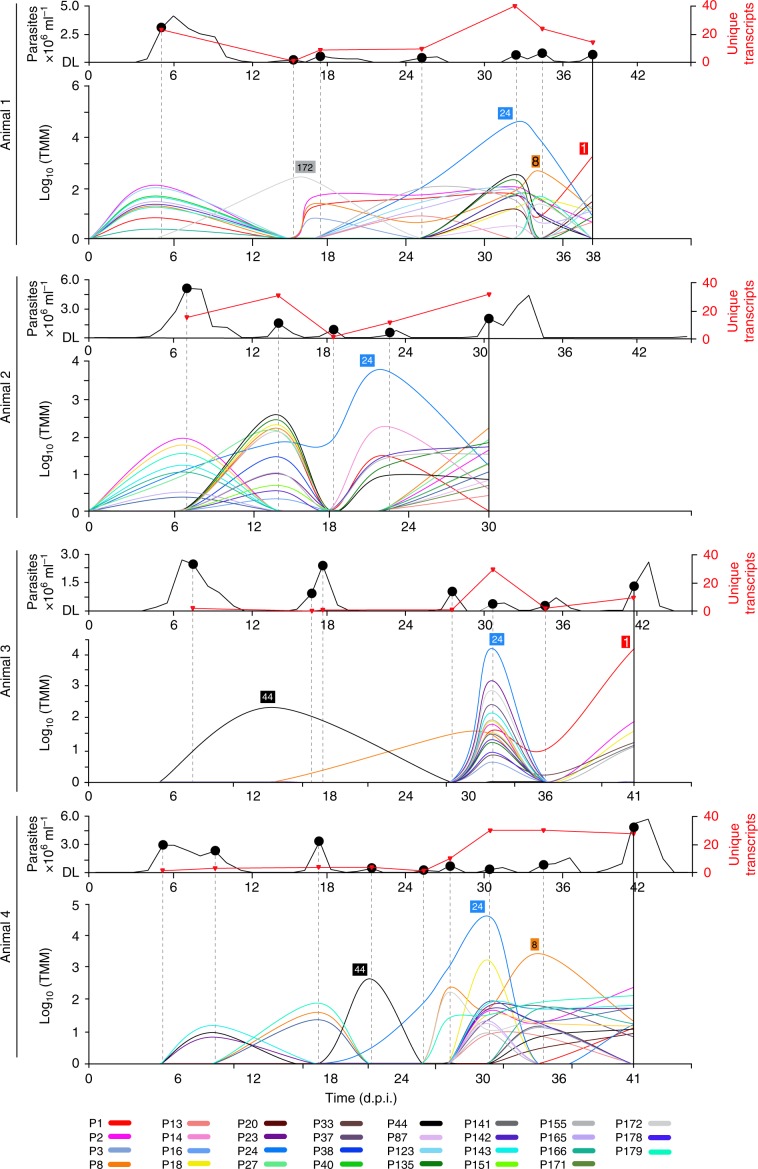
Fig. 4. VSG phylotype expression during experimental T. vivax Lins infections in a goat model (N = 4).
Parasitaemia (black line) is shown in the upper graph (detection limit (DL)) was 4.1 × 10³ trypanosome per millilitre of blood). Parasite RNA was isolated at peaks in parasitaemia, indicated as black dots. The number of unique VSG transcripts (red line) observed in each transcriptome is plotted on the same axis. The lower line graph shows the combined transcript abundance for each VSG phylotype (shaded according to key) through the experiment (days post infection) for four replicates animals (A1–A4 from top to bottom). Note that phylotypes can comprise several, distinct transcripts of variable abundance. Across all peaks in all animals, a phylotype was represented by a single transcript in 105/196 observations, (mean = 1.88 ± 1.26 s.d.). However, across the 31 expressed phylotypes, only eight (P3, P13, P14, P16, P38, P141, P151 and P178) occur as single transcripts on every occasion when they were observed. Thus, while a slight majority of phylotypes are represented by only one transcript at a given peak, most phylotypes are present as multiple transcripts at some point. Phylotypes that were dominant (i.e. superabundant) are labelled adjacent to the pertinent lines. A superabundant VSG was defined as having an expression level at least ten times that of the next most abundant VSG, and this was observed at 15/28 peaks. For example, P24 is 128 times more abundant than P44 at peak 5 in A1, and P1 is 32 times more abundant than P155 at peak 7. The classical expectation of VSG expression is that a peak will include a single superabundant VSG like this; often, however, several co-dominant VSG phylotypes occurred with comparable expression levels, for example at peak 1 in A1 and A2. Source data are provided as a Source Data file.

