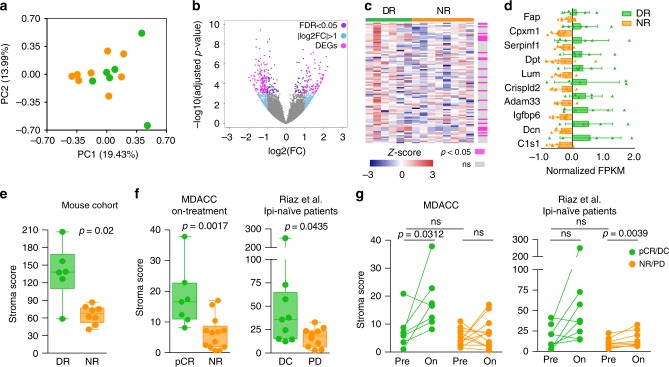
Fig. 3. Stroma remodeling in melanomas with durable responses to ICIs.
a Principal component analysis (PCA) plot of RNA-seq data from DR (green, n = 6 tumors) and NR (orange, n = 8 tumors). Dot, single tumor; PC, principal component. b Volcano plot of DEGs (differentially expressed genes, magenta) in DR and NR tumors with FDR (false discovery rate) < 0.05 and |log2FC| (absolute log2 fold change) >1. c Heatmap representing gene expression of previously reported lineage-specific markers23 of cancer-associated fibroblasts (CAFs) in DR (green, n = 6 tumors) and NR (orange, n = 8 tumors). Significantly differentially expressed genes (pink, p < 0.05) are highlighted using DESeq2 algorithm. Column, single tumor; row, gene; ns, not significant (gray). d Gene expression of the top ten CAF markers significantly upregulated in DR (green, n = 6 tumors) versus NR (orange, n = 8 tumors). FPKM values for each gene are normalized to the mean expression obtained from all tumors. Triangle, single tumor; bar, mean of the response group; error bar, standard deviation. e Stroma score generated from the 10-gene CAF signature in d for DR (green, n = 6 tumors) and NR (orange, n = 8 tumors). Two-tailed Mann–Whitney U test was performed to determine statistical difference between the response groups. Dot, single tumor; hinges, 25th and 75th percentiles; middle line, median; whiskers, minimum to maximum value. f Stroma score of melanoma samples from ICI-naive patients on-treatment with nivolumab monotherapy or in combination with ipilimumab from MDACC (left; pCR = 7 and NR = 13) and Riaz ipilimumab-naive18 (right; DC = 9 and PD = 10) cohorts. Two-tailed Mann–Whitney U test was performed to determine statistical difference between the response groups. Dot, single tumor; hinges, 25th and 75th percentiles; middle line, median; whiskers, minimum to maximum value. g Stroma score for paired pre- and on-treatment tumor samples from MDACC (left; pCR = 7 and NR = 12 patients) and Riaz ipilimumab-naive18 (right; DC = 8 and PD = 9 patients) cohorts. Two-tailed Wilcoxon test was performed to determine statistical difference between matched pre- and on-treatment samples, two-tailed Mann–Whitney U test was performed to determine statistical difference between response groups in pre- or on-treatment samples. pCR pathologic complete response, NR non-responder, DC disease control, PD progressive disease. Dot, single tumor; line, paired samples; ns, not significant.

