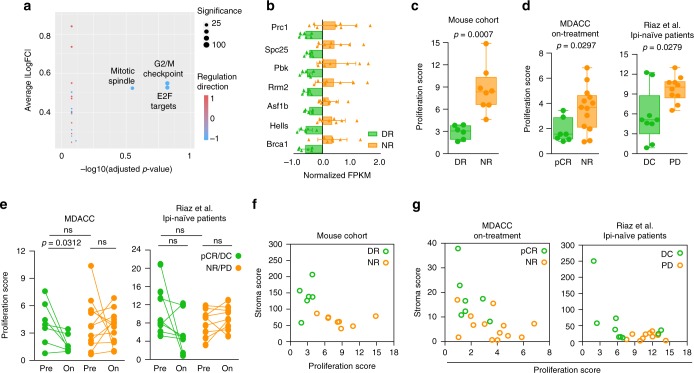
Fig. 4. Tumor proliferation and stroma remodeling identify responding tumors early during treatment.
a The top 20 differentially expressed hallmark signatures36 in RNAseq from DR (n = 6 tumors) and NR (n = 8 tumors) from mouse are reported in the plot. FC fold change. b Gene expression of the seven downregulated genes in DR vs. NR tumors included in the proliferation signature. FPKM values for each gene are normalized to the mean expression obtained from all tumors. Triangle, single tumor, bar, mean of the response group; error bar, standard deviation. c Proliferation score generated from the 7-gene signature in b for DR (green, n = 6 tumors) and NR (orange, n = 8 tumors). Two-tailed Mann–Whitney U test was performed to determine statistical difference between the response groups. Dot, single tumor; hinges, 25th and 75th percentiles; middle line, median; whiskers, minimum to maximum value. d Proliferation score of melanoma samples from ICI-naive patients on-treatment with nivolumab monotherapy or in combination with ipilimumab from MDACC cohort (left; pCR = 7 patients and NR = 13 patients) and Riaz ipilimumab-naive18 (right; DC = 9 patients and PD = 10 patients) cohorts. Two-tailed Mann–Whitney U test was performed to determine statistical difference between the response groups. Dot, single tumor; hinges, 25th and 75th percentiles; middle line, median; whiskers, minimum to maximum value. e Proliferation score for paired pre- and on-treatment samples from MDACC (left; pCR = 7 patients and NR = 12 patients) and Riaz ipilimumab-naive[18] (right; DC = 8 patients and PD = 9 patients) cohorts. Two-tailed Wilcoxon test was performed to determine statistical difference between matched pre- and on-treatment samples, two-tailed Mann–Whitney U test was performed for difference evaluation between response groups in pre- or on-treatment samples. Dot, single tumor; line, paired samples; ns, not significant. f Scatter plot of stroma vs. proliferation score for DR (green, n = 6 tumors) and NR (orange, n = 8 tumors) from mice treated with anti-PD-1. Circle, single tumor. g Scatter plot of stroma vs. proliferation score for DC and PD melanoma samples from MDACC (left; pCR = 7 patients and NR = 13 patients) and Riaz ipilimumab-naive18 (right; DC = 9 patients and PD = 10 patients) cohorts. Circle, single tumor. pCR, green, pathologic complete response; NR, orange, non-responder; DC, green, disease control; PD, orange, progressive disease.

